


BUFFET FLASHES RED, BULLS SEE GREEN
06/29/25 Prospero.ai Investing - 233rd Edition (Weekend)

Hey Prospero Family, a quick but important update to start our letter. First, I wanted to say a huge congratulations to our CEO George Kailas for getting engaged last week! My man showed us all up. I personally asked my wife to marry me under a live oak tree in College Station, Tx. George popped the question, in France, under the Eiffel Tower! They're an amazing couple and we wish them many years of health and happiness.

Now to the topic at hand. As you have probably heard, both the S&P 500 and Nasdaq reached a new all-time high last week. It's been an incredible ride, but the question we're asking: "Will we see further upside, or is a correction imminent?" To find an answer, we'll unpack two important data points (one positive, one negative) for you to be aware of heading into July. At the end of our introduction, we'll check out our friend and partner, @wolf_financial's advice on how to trade after an all-time high! Let's start with the good news regarding this market.
1. SPY and Net Options Sentiment have turned significantly more bullish.
Over the last few weeks, we've seen an interesting divergence in our QQQ and SPY Net Options Scores. For those new to Prospero, we typically place our Net Options bullish line for the Index ETFs (SPY and QQQ) above 40. We're Bearish when Net Options Sentiment drops below 30. Historically, when those numbers dropped to 0 (and stayed there), that almost always signaled a coming downward correction. For example, 48 hours before the start of March/April's 20% correction, SPY Net Options was dropped to 0 and QQQ to 3! Interestingly, over the last few weeks, SPY NOS has hovered near 0, while QQQ NOS has stayed slightly above our bullish zone of 40! That has happened in the past, but to my knowledge it's never stayed in that range as long as we've seen it over the last few weeks. Honestly, it's been a difficult market to trade. It's hard to know if the market is going up or down, when one index is very bearish and one is bullish. The only explanation for that divergence in scores, is that institutions were just as confused about the future of the market as retail and were hedging. They played the upside in Tech (QQQ) but hedged the downside with SPY. BUT as of yesterday, that suddenly changed. When all-highs were finally broken, QQQ Net Options broke even more bullish into the 60's; while SPY Net Options rallied into the 20's (ended the day at 19). While 19 is still below our bearish line, any time you see a 19-20 point upward swing in both SPY and QQQ NOS, that is very bullish. At the same time, Gold dropped over 2% and the VIX around 1.6%. The point is that all of this is pointing to more of a "risk on" behavior toward the end of the week. One final note, President's Trump's statements on Friday afternoon about cutting off trade negotiations with Canada, may have caused the market to drop, but it didn't drop Net Options Sentiment! That's telling and when you combine that with the reality that July (in post-election years) has been historically bullish, there's a decent chance we see more upside in the days to come. BUT with that in mind, there's one huge warning sign that started blaring on Friday.
2. The "Warren Buffet Indicator" just surpassed its all time high.
That's a REALLY big deal; let me explain. To get the Warren Buffett indicator, you take the total value of U.S. equities and divide it by the U.S.'s Gross Domestic Product.
Warren Buffett Indicator = Total U.S. Stock Market Cap / GDP
As we speak, that number is about 205%. In other words, the total value of all U.S. equities are twice the size of the United States Economy. That is historically extreme territory! For context, the current level surpasses the previous all-time highs recorded in 2000 (Dot.Com Bubble) and 2021 (Everything Bubble). Let that sink in for a second. The current level is higher than two of the biggest bubbles in stock market history. Warren Buffett himself argued that when the indicator gets above 200%, you're "playing with fire". We're 5 points past the line where Buffet considers reckless. Now, one could argue that it's "different this time". The fact remains, because of A.I we're arguably entering into the 4th industrial revolution. But the Oracle of Omaha would tell us that we're treading on shaky ground. One major difference I see in those first two bubbles and now, is that in both those previous instances, the Fear and Greed Index was pegged at Extreme Greed (Score 80-90). But currently, the index scores around 65, which indicates investor confidence, but not the euphoric extremes of those previous two bubbles. The takeaway from all of this? Anything is possible, but when you put all that data together, it's very possible, we have more upside to go. With that in mind, let's look at our friend, @wolf_financial's, "profit crushing mistakes" while trading all-time highs @Wolf_Financial Post. By the way, I'm very guilty of #2 & #3….
1. Mistake #1 Waiting for a crash: During all time highs, investors tend to pile up cash and miss out on the run up. Why? They fear buying the top and end up sitting on the sidelines while others make money. Be smart, but don't be afraid to look new opportunities.
2. Mistake #2 Selling Too Soon: Don't sell too soon. While it's important to take profit after a huge run up, if you sell everything too soon you can miss out on gains.
3. Mistake #3 Panic Selling Minor Dips: Many people make the mistake of selling everything at the first sign of volatility.
4. Mistake #4 Not Rebalancing: After you take profit, put some of that capital to work in other areas.
5. Mistake #5 failing to see the signs: Eventually the bull market will end. Before that occurs, here are some of the sign.
Insane Valuations: That's happening.
Euphoria: Not there yet.
Now a word from our CEO…
A WORD FROM OUR CEO
It would have been a better week if we weren’t hedging due to SPY Net Options Sentiment remaining low. But assuming the week starts off strong we will take on more risk tomorrow. Our paper trading portfolio 76% above the market annualized with a win rate of 60% against SPY benchmarks.
Our short intro + learning videos get you up to speed on how best use our letters and app to increase your wins.
I am still traveling so only one stream this week. Monday at 10:15 AM.
Track all of your investments in real time with our app. Prospero’s proprietary AI tech updates key options signals like Net Options Sentiment, Upside and Downside every 3 minutes.

BUFFET FLASHES RED, BULLS SEE GREEN
Market/Macro Update w/ Cap/ Value Analysis
QQQ and SPY Net Options Sentiment
Sector Analysis
How we view the Sector performance and momentum
Portfolio Strategy
Putting it all together to make a portfolio that first controls for risks but also has upside
Longs
Adds —> Keeps —> Drops
Shorts
Adds —> Keeps —> Drops
Portfolio Summary
CAP/VALUE ANALYSIS

Growth has regained leadership with strength across the board this week. Large Cap Growth continues to dominate, rising 2.54% on the week and 3.92% for the month, continuing to build on its yearly growth. Mid Cap Growth followed closely with a weekly gain of 2.10% and 3.29% monthly, further solidifying investor preference for size and scalability. Compared to its larger siblings, Small Cap Growth lags behind, up 0.74% on the week, with its monthly return sitting just above 2%. Value saw small gains too, Small Cap Value added 1.22% this week, and Large Cap Value 1.12%, with Mid Cap Value lagging at 0.75%. Despite persistent global tensions, investors appear to be rotating back into risk, with Large and Mid Cap Growth sectors showing the strongest momentum and benefiting most from macro optimism around AI and softer inflation data.
SECTOR ANALYSIS
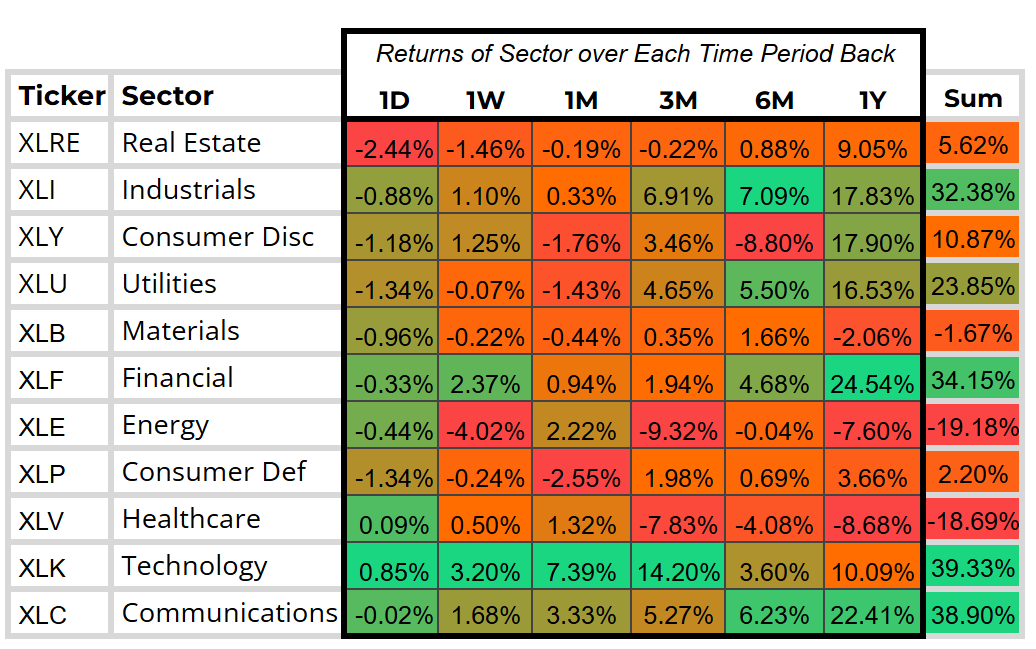
Technology led all sectors this week with a decisive 3.20% gain, bringing its monthly returns to a healthy 7.39%, and 3 month returns doubling that figure. Communications, though having a weaker performance by about 50% compared to Tech at +1.68% on the week and +3.33% for the month, still maintains a healthy lead of over 10% on a yearly timescale. Industrials held fairly steady for the week with +1.10%, though it dipped 0.88% on Friday. Financials rose a respectable 2.37% on the week, helping it stay afloat despite a pretty muted month. On the weaker end, Energy dropped 4.02% and remains the worst-performing sector over the last 3 months at -9.32%, as the escalation in the Middle East shot it up before it was quickly settled. Healthcare also continued to underperform, up just half a percentage point this week and down 8.68% over the past year, continuing to struggle along with other defensive sectors in this beta-heavy market. Overall, performance remains heavily skewed toward growth and cyclical sectors.
SPY/QQQ NET OPTIONS SENTIMENT

After continuing its near month-long trend of hovering around 0 at the start of the week, SPY NOS finally saw some positive in the last couple days before the weekend as it steeply rose on June 26th. While there was a brief crash, NOS quickly recovered on the 27th, ending the day almost 10 points above zero for the first time since early June. While wider news such as a cooling of conflict in the Middle East, reignited hope in Tech and AI, and rate cut expectations all certainly helped, the driving factor may have been SPY 614 call options expiring trading at exceptionally high volumes, suggesting professional investors may be leaning into upside momentum.

After having an incredibly rough week after the escalation of the Israel-Iran conflict pushed traders bearish and away from the volatile stocks that make up much of the QQQ, weekend activity and cooling of tensions in the Middle East quickly sent both QQQ NOS and price up together, with traders unwinding their protective positions potentially sending it even higher. This rally may not be driven by purely bullish sentiment, with it more likely being a return to the confidence we saw a couple weeks ago.
PORTFOLIO STRATEGY
We are going to keep it simple — a well hedged 4 long and 4 short position to start the week. We are playing it cautious because we don’t know what may come out of Canada or the US tomorrow. But if everything looks good at market open we will look to take on a few more longs.
Long / Bull Moves
Long / Bull Moves - No new adds / META, UNH, GS, AMD holds / PH, LLY, CASY, NRG, SLAB, PLTR drops
Adds
There were no new long adds this week, as SPY and QQQ rallies may mean that many stocks are overextended, making buying incredibly risky as stocks may drop quickly if there is bad news on the trade front.
Holds
META continues to rank number 1 in our screener, and with such strong metrics it is clear why. There is still plenty of Upside and with such strong Options Sentiment there is still plenty of potential here. UNH having stronger Options Sentiment and Upside than REGN left a clear choice in Healthcare despite its lower rank right now, and GS and AMD, while being screened out still have strong metrics and look poised to continue growing as AMD forecasts strong demand for AI processing and GS benefiting from the surge in market activities we have seen.
Drops
With slowdowns in Industrials and Utilities we decided to drop PH and NRG, LLY was dropped due to us still holding a stronger UNH, while CASY and PLTR look to be trading at a premium compared to other similar companies. While SLAB, although fairly valued faces problems with Asian competition having the potential to weaken the stock while the company continues to struggle with inventory issues, with the company currently being unprofitable.
Short / Bear Moves

Short / Bear Moves - BXP added / BMY, CRWV, TMHC holds / AVB, COLM drops
Adds
BXP was added in Real Estate as occupancy dropped in Q1 and the company continues to face issues to overcome the hit that remote work has caused on the company, especially in places such as Manhattan and San Francisco. Additionally, weak metrics in Tech Flow, Options Sentiment, and Momentum all sitting around 20 reinforce this decision.
Holds
While ranking out of the top 200, BMY looks to be an enticing Healthcare short as outlook for the company looks grim amid recent news of an antitrust suit from Cigna. We’re continuing to hold CRWV as the hype driving the company’s overvaluation is not supported by key metrics, meaning CRWV is at a high risk of unwinding quickly. TMHC was held in Consumer Cyclical despite its low ranking as the company is very sensitive to rate changes and their effects on demand, as well as limited upside signaling that even if the stock doesn’t drop, it is incredibly unlikely it’ll turn bullish.
Drops
AVB was dropped in Real Estate in exchange for a weaker BXP, and COLM was let go in Consumer Cyclical as strong financials paired with the current price sitting at a 5 year low, suggesting that the stock may be undervalued.
Portfolio Summary
Long / Bull Moves - No new adds / META, UNH, GS, AMD holds / PH, LLY, CASY, NRG, SLAB, PLTR drops
Short / Bear Moves - BXP added / BMY, CRWV, TMHC holds / AVB, COLM drops
4 Longs: META, UNH, GS, AMD
4 Shorts: BXP, BMY, CRWV, TMHC
Paid Investing Letter Bonus with Momentum Score
Keep reading with a 7-day free trial
Subscribe to Prospero.Ai Investing Newsletter to keep reading this post and get 7 days of free access to the full post archives.