Put your seatbelt on, because this week, our CEO George Kailas performed a deep dive into some of Prospero's data, and what he found is a trend in several companies' growth and profitability that is honestly fascinating. Here's why. We've talked at length about how we believe that because of A.I., we're in the early innings of a new industrial revolution. The data that George discovered, further proves our thesis. Here's a chart of the data, then I will attempt to explain:
To understand the chart, let me quickly explain two of Prospero's signals: Profitability and Growth.
Profitability Rating: A long term signal used to demonstrate a company's ability to be profitable over the next year or two. An 80 or above demonstrates that a company has the ability to consistently yield profits both now and in the future.
Growth Rating: A long term signal that indicates how likely a company is to get bigger in revenue and/or size over the next two years. A score of 80 or above shows a strong likelihood that a company will grow by a significant amount over the next couple of years.
Now look at the graph again. George ran a study on companies with a profitability rating of 90 or greater. Their average growth score was 47.61.
Then he looked at all the companies with a profitability rating of less than 10. Their average growth score was only slightly higher at 53.79.
Here's why we find that fascinating…
Traditionally, Small Cap Stocks have low Profitability Scores and higher Growth Scores. Right? Small Caps aren't as profitable, but their potential for growth is enormous. Think Biotech start ups. Not much profitability, but massive potential for growth.
Traditionally Large Cap Stocks have higher Profitability Scores and lower Growth Scores. Makes sense. Large Caps have higher profitability, but their potential for future growth is limited. Think large, traditional automakers. Lots of profit, very limited future growth.
BUT, something is changing! What Prospero's data shows is that companies with a Profitability Score of greater than 90 (Typically Large Caps) are growing at almost the EXACT SAME RATE as Small Cap stocks! Not only this but you are actually getting more growth from companies in the 90th percent tile than the 80th. As well as less growth in the 10th precent tile than the 20th. Both the inverse of what you’d expect.
If you go back in history and look at the instances where this has occurred, you'll find that happened almost exclusively during industrial revolutions with the advent of steel, railroads, electricity, oil and telecommunications. Why? Because when a brand new, paradigm shifting technology was discovered, it was the companies with the most capital (cash on hand) that had the ability to monopolize on the products and talent needed to produce the greatest amount growth.
What our data is showing, is that this same shift is occurring. Think about it. Nvidia is growing revenue and profit every quarter in the BILLIONS of dollars. Yet, at the same time, they're experiencing the greatest amount of growth. Why? Their profit gives them the ability to fuel future growth! They have more money than they know what to do with; so why not go find the best talent on the planet, and create even more advancements, which will fuel even more profit and growth.
What are the implications of all of this? It's hard to know for certain and you'd need a Phd in Macroeconomics to fully answer the question. But the short answer is that history points to the formation of monopolies. Bottom line is the rich get richer and the poor get relatively poorer.
Companies like Tesla, Microsoft, Nvidia, Google, Apple, Meta are the companies that have the greatest ability to use their hoards of cash to take hold of the opportunity the current advancements in technology are presenting. Because of this, Small Caps will find it harder and harder to keep up. (thus the title, 'All Capped Out'). The rich could get richer at increasingly accelerating rates.
And by the way, each and every time this happened in the past, the world looked radically different in just a couple of decades. We are living in wildly fascinating and unprecedented times. But, I guess it beats being bored! Now let's hear a word from our CEO George Kailas.
A WORD FROM OUR CEO
Our strategy of a smaller, higher conviction portfolio continues to see us gradually improving and beating the S&P 500 by 81% annualized, with a win rate of 61% against SPY benchmarks.
To help newer readers get up to speed linking our short intro + learning videos.
Normal streams this week! Monday 9/23 at 11 AM EST and Wednesday 9/25 at 3PM EST.
Don’t have our app yet? Use it to track your investments with Prospero’s proprietary AI tech.
CAPPED OUT
Market/Macro Update w/ Cap/ Value Analysis
QQQ and SPY Net Options Sentiment
Sector Analysis
How we view the Sector performance and momentum
Portfolio Strategy
Putting it all together to make a portfolio that first controls for risks but also has upside
Longs
Adds —> Keeps —> Drops
Shorts
Adds —> Keeps —> Drops
Portfolio Summary
Market/Macro Update w/ Cap/ Value Analysis
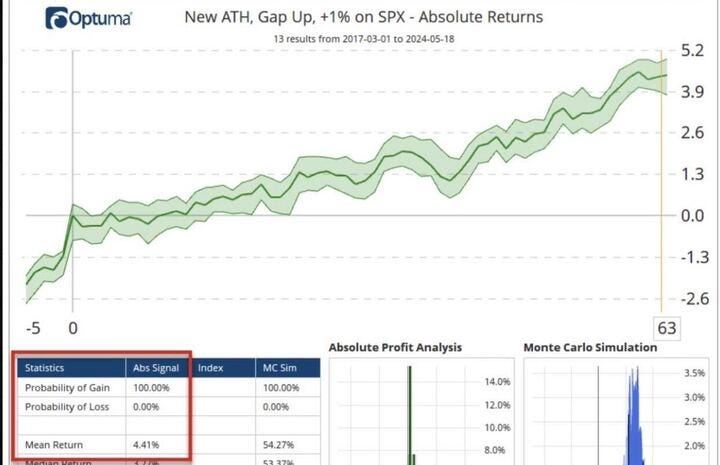
The long awaited rate cut was announced by the Fed last week and the markets rallied by over 1% after the announcement. The S&P 500 broke through its upper resistance and experienced its first all time high in weeks, but then slightly retracted into the weekend. This was 39th all time high for the S&P for the year. With that comes some good news. Check out the graphic below (Via Optuma):
Since 2017, when the S&P jumped 1% or greater to an all time high, the probability of another all time high being reached within the same year is 100%. The mean return of that jump is 4.41%. Based on the data since 2017, the odds of this bull run continuing are very high. Our SPY and QQQ Net Options Sentiment finished the week within our Bullish margin, (QQQ more so than SPY) so it looks as if we might have some more growth to go. As always, we want to watch the numbers closely for a sign of a reversal.
CAP/VALUE ANALYSIS
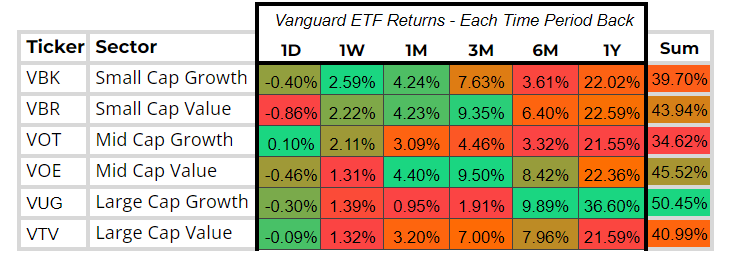
Small Caps growth and value had a strong month. But so did Mid Cap Value, which grew more than any other Cap. This is a good sign for the expansion of market breadth and strength. Large Caps were in the positive for the week, but didn't see the rebound of Small and Mid Caps. It will be interesting to see if that trend continues over the next couple of weeks.
NET OPTIONS SENTIMENT
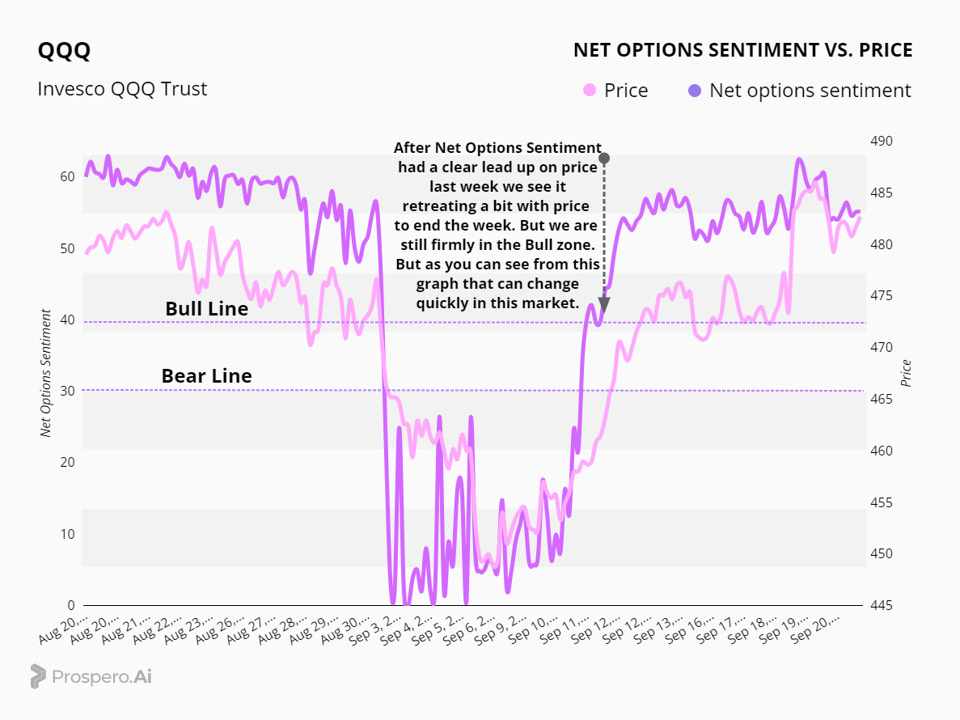
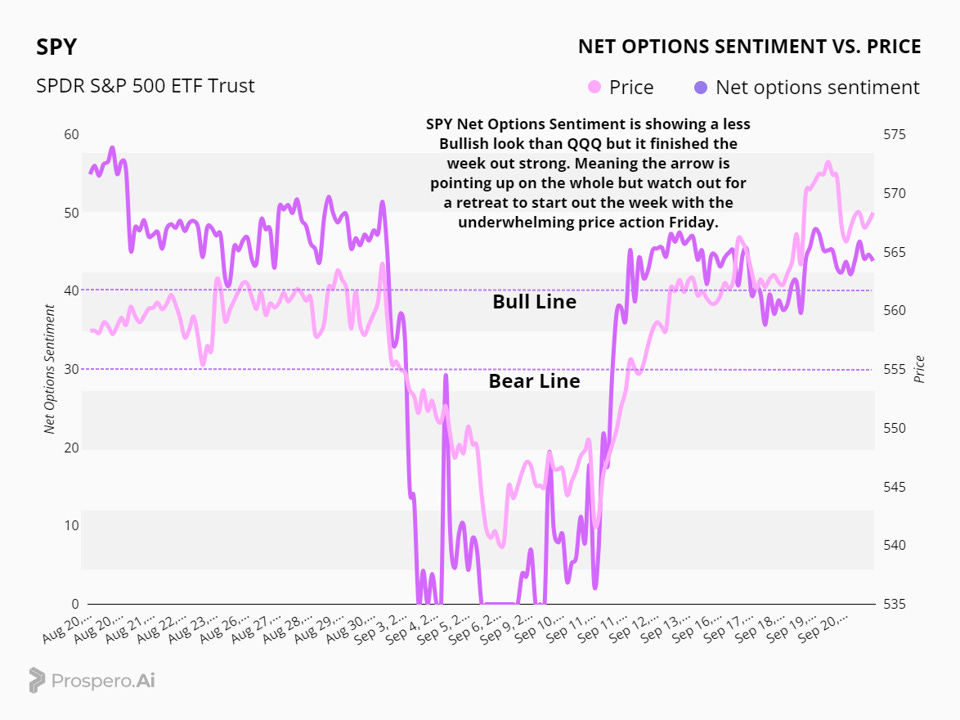
SPY and QQQ Net Options Sentiment > 40 = Bullish < 30 = Bearish.
Check out the QQQ Net Options Sentiment chart below. We saw QQQ numbers jump and have a clear lead up before the move in price last week, but then surrendered a bit to finish out Friday. The good news is that our numbers are still firmly in the Bull Zone. As you can see from simply looking at the Net Options Line in dark purple, things can change quickly in this volatile market environment. As we approach October of an election year, it's important that we remain vigilant to watch for a shift in numbers
Check out the Spy Net Options Chart above. SPY numbers lagged QQQ all last week, but finished the week on a slight upward trajectory. When the market opens we will be watching for any change of direction in the SPY numbers, primarily because stocks performed so poorly on Friday. That price action could easily continue on Monday morning.
SECTOR ANALYSIS
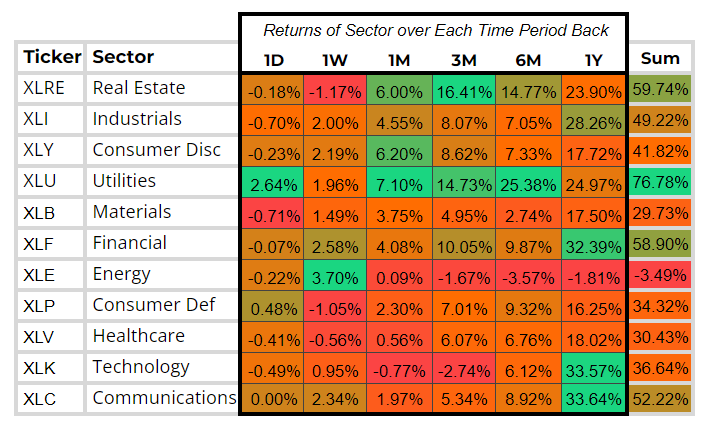
Check out the Sector Analysis Table above. One sector that leaps off the page is Energy. The bottom in Energy is likely in, and could potentially be an area of strength in the coming weeks. That, of course, can change quickly depending on the outcome of the election. Utilities continue to show relative strength, which further proves that people are NOT risk–on in this current volatile environment. Healthcare and Consumer Defensive and Real Estate (sell the news after rate cut) showed the greatest weakness last week.
PORTFOLIO STRATEGY
Not much of a difference between last week and this week. Overall Bullish market that is still experiencing a lot of volatility. Given the slighly red Friday we will be a little more conservative than last week 5 Bulls and 3 Bear picks.
Long / Bull Moves
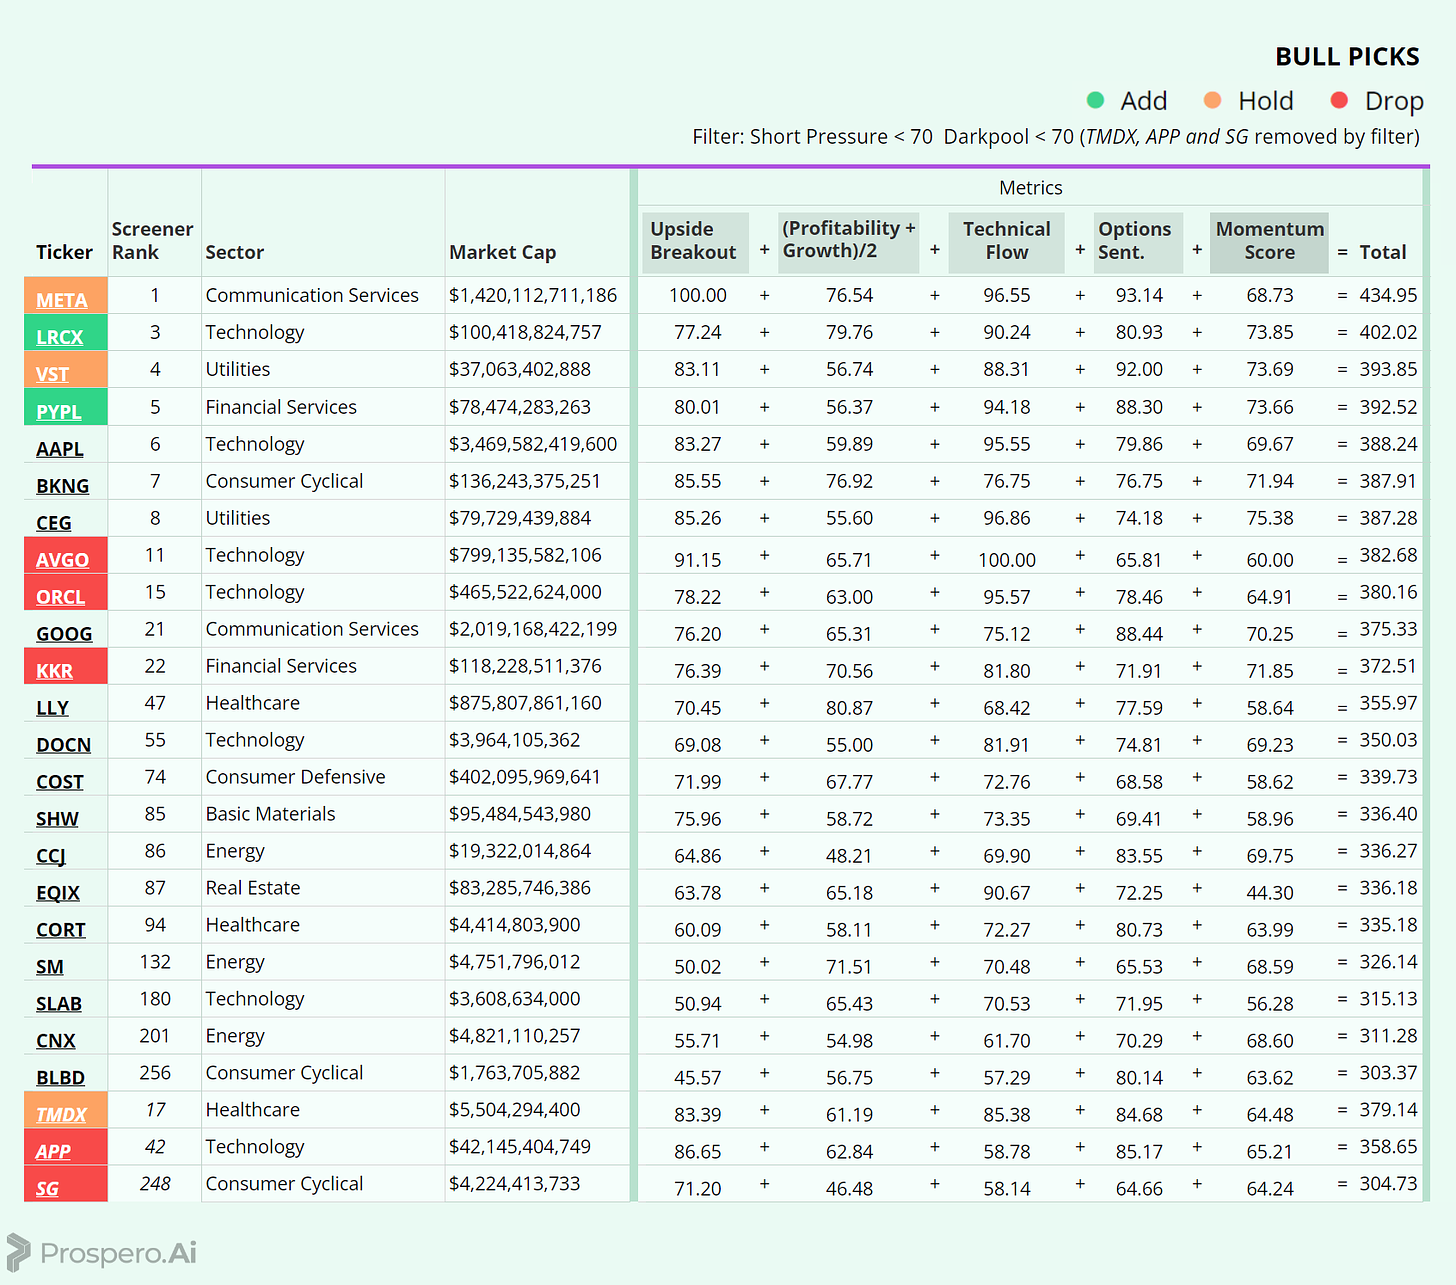
Long / Bull Moves - LRCX and PYPL adds / META, VRT and TMDX holds / AVGO, ORCL, KKR, APP and SG drops
Adds
As straightforward as it gets here we added the top stocks in our Screener this week.
Holds
META and VRT were easy holds as they made up a diversified top 4 in the Screener. TMDX was held because it was by far the highest ranked Smaller Cap stock even with the added risk of being filtered out.
Drops
If we were keeping a larger portfolio there were good cases for any of the dropped stocks AVGO, ORCL, KKR, APP and SG but there were simply better ranked options out there this week.
Short / Bear Moves
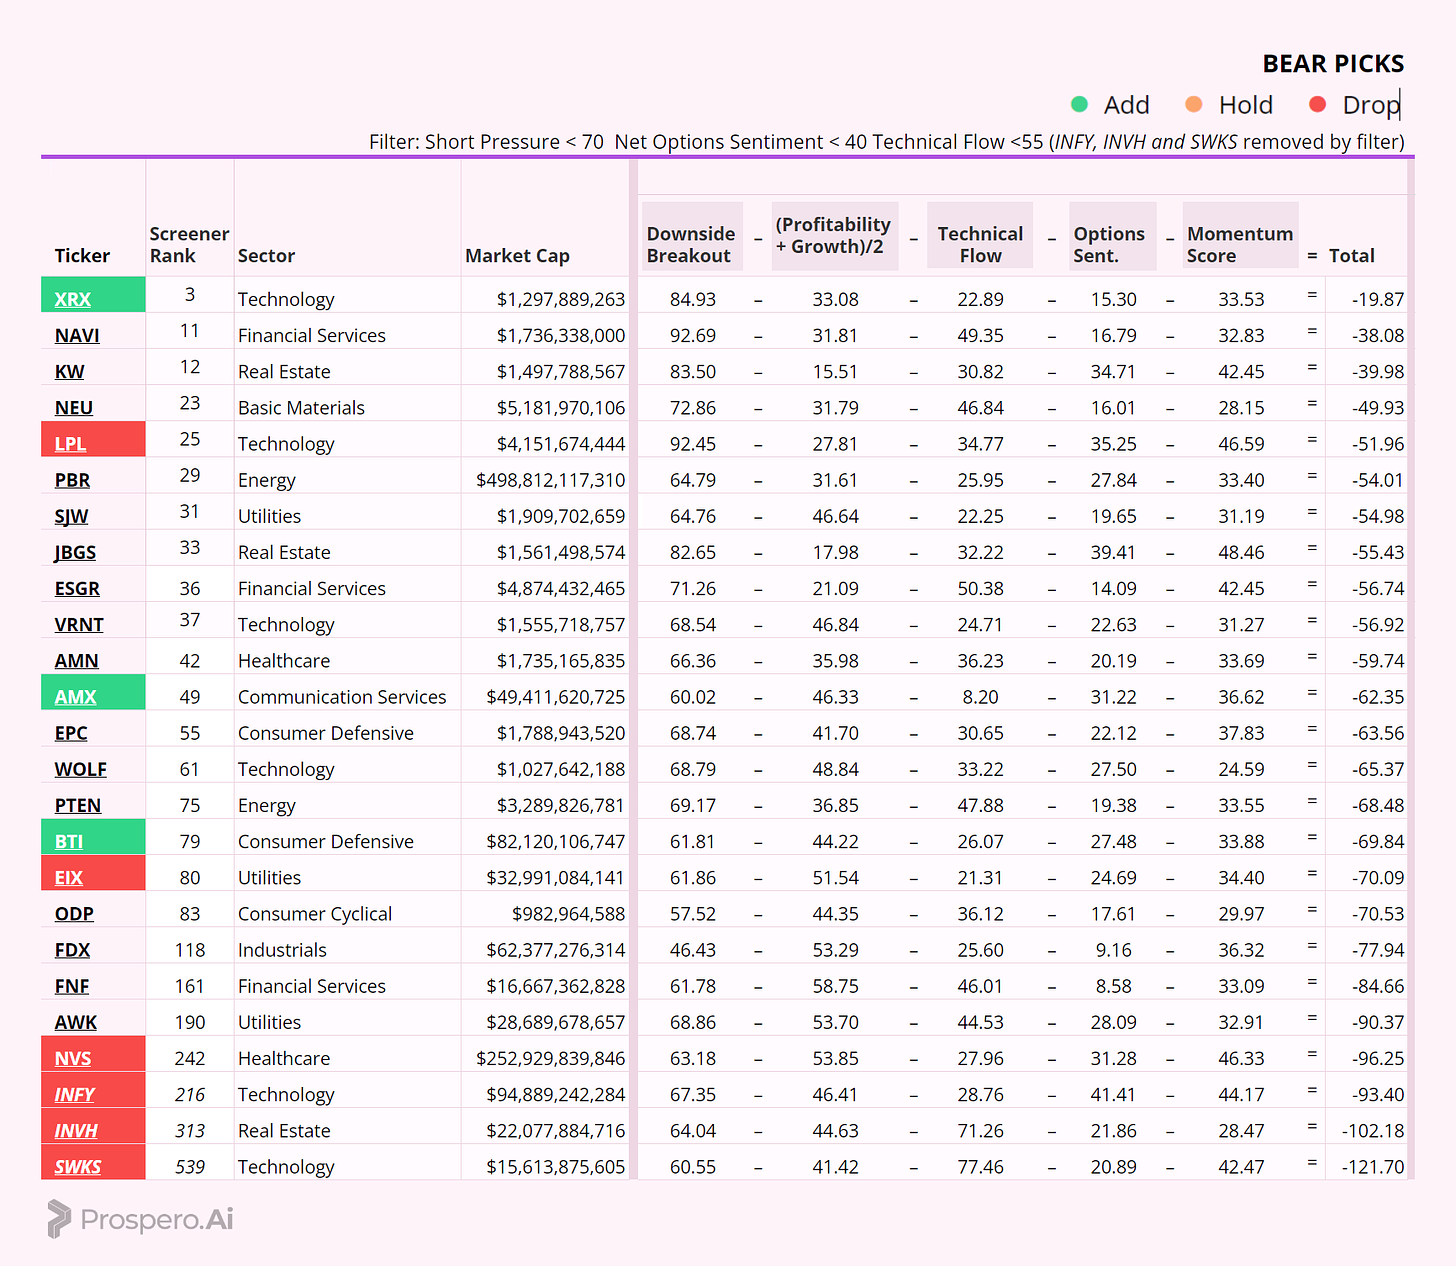
Short / Bear Moves - XRX, AMX and BTI adds / no holds / LPL, EIX, NVS, INFY, INVH and SWKS drops
Adds
We went with the #1 stock in the Screener here but did not want to be overexposed to Small Caps as they did have a nice week last week. So our other two picks were the best ranked Larger Cap stocks.
No Holds
Drops
LPL was dropped because there was a better ranked option in Tech and EIX, NVS, INFY, INVH and SWKS were all dropped because of a poor ranking in the screener.
Portfolio Summary
Long / Bull Moves - LRCX and PYPL adds / META, VRT and TMDX holds / AVGO, ORCL, KKR, APP and SG drops
Short / Bear Moves - XRX, AMX and BTI adds / no holds / LPL, EIX, NVS, INFY, INVH and SWKS drops
5 Longs: META, VRT, LRCX, PYPL and TMDX
3 Shorts: XRX, AMX and BTI


