

MEMORY LEAK?
05/25/26 Prospero.ai Investing - 321st Edition (Weekend)


Picture a herd of cattle out grazing in a field. They’re peaceful, still and focused on the grass. Suddenly, one cow gets spooked and takes off running. The one next to it doesn’t stop to figure out why, it takes off too. Then the next and the next. Within a few seconds the whole herd is in a dead sprint. Later that afternoon they’re all hanging out in the barn and one of the cows asked the herd why they all ran? They all kind of looked at each other and shrugged: “I ran because you ran!”
That, my friends, is what’s called “herd” mentality and the market is acting in a very similar fashion. Everywhere you look, there’s a stampede, but it isn’t a stampede of greed, it’s more of a stampede of fear from this one question: “Is this 1999 all over again?” It’s on every podcast and market television show and financial Twitter. Here’s the narrative – The AI boom is just the dot-com bubble wearing a new outfit; and we all know how that movie ended.
And that, right there, is the problem! When everybody knows something, that’s usually the exact moment to stop running with the herd and find out for yourself what caused the herd to start running in the first place.
Fear Vs. Facts
The reality is there are similarities between today and the Dot.com bust, but there’s also fundamental differences. For example, one of the most often cited Dot.com vs Ai boom narratives, is the Nvidia vs Cisco comparison. In 1999-2000, Cisco was the company selling the essential “picks and shovels” of a ground breaking technology called “The World Wide Web.” Nvidia is selling the picks and shovels of a ground breaking technology called AI. Both have experienced exponential growth. Both had the market on their back. So if you’re looking for a pattern, you can find one. But remember the herd mentality? Running because the animal next to you got spooked instead of actually scanning for danger? Let’s start scanning by looking at some rough math:
Cisco’s stock % rise from 1995 to 2000 = + 3800%
Nvidia’s stock % rise from from 2021 to 2026 = +1500 %
That alone tells you that NVDA hasn’t run as “hot” as Cisco’s. But the important math to look at is the stock’s valuation. In other words, how expensive is the stock, really? Quick definition for newer folks: a P/E ratio is the price you pay for each dollar of a company’s yearly profit. A “forward” P/E uses next year’s expected profit. The thing to remember: Lower P/E number = stock is cheaper. Let’s compare Cisco and Nvidia:
Cisco’s Forward P/E Ratio at the Dot.com height: 130-150x
Nvidia’s Forward P/E Ratio as of last week: 25-26x
There’s simply no comparison on those stock’s actual value compared to their earnings. Let’s Zoom out a bit and look at the valuation of the Nasdaq 100 (Big Tech Index). At the March 2000 peak, the Nasdaq-100 traded at roughly 60 times forward earnings. Today it’s trading around 32! The current index is priced at barely half the multiple it carried back in 2000. The current state of the top 100 tech companies is expensive, it’s not grossly over extended.
Where the Herd Gets It Right
Looking back at the Dot.com years, asking WHY Cisco crashed is the real lesson. Because the dot-com bust actually happened for two completely different reasons:
1. Fake earnings. Pets.com, Webvan, and dozens like them barely made money, if at all. It was all speculation. When the funding dried up, there was nothing underneath.
2. The real earnings that didn’t last. This was Cisco. Cisco was no Pets.com. It was hugely profitable, a genuine blue-chip, the literal backbone of the early internet. Its earnings were 100% real. But, its earnings ended up being cyclical, based purely on the run up of the internet. After that ended, so did the stock’s meteoric rise.
Are today’s AI leaders fake, like Pets.com? No, not even close. Nvidia, Microsoft, Meta, Google are among the most profitable companies that have ever existed. The “fake earnings” way of breaking is basically off the table. On that point, the fear crowd is simply wrong.
But the Cisco question; will the earnings last? That’s a legit concern. Because Nvidia’s enormous profits are coming from a building boom too. A small group of giant customers: Meta, Microsoft, Google, Amazon, are spending hundreds of billions of dollars building AI data centers. That spending is Nvidia’s revenue.
So the real question isn’t “are these profits real?” They 100% are real. The real question: is that level of spending a permanent, every-single-year thing? Or is it a one time build-out that eventually slows down? The Bulls argument for continuation of the earnings, is that AI will continue to increase the rate of technological change at a constant rate, and will therefore continue the money train. But the reality is that we’re in uncharted territory and nobody knows for sure. Anyone who tells you they’re certain are either lying or are misinformed.
Where the “Herd” is getting it wrong:
While everyone’s busy panicking about some expensive names, it’s overshadowed the reality that there are some high growth plays that are arguably undervalued.
Example: Memory Chip Companies: the companies making the memory that AI systems gobble up by the truckload. They aren’t theoretically cheap, some are arguably and actually downright cheap!
1. Micron: It’s one of only three players on the entire planet that make “high-bandwidth memory,” the specialized chips that sit right next to AI processors and feed them data fast enough to keep up. Demand has been so ferocious that Micron’s entire 2026 production is already sold out under multi-year contracts. And the numbers are staggering: revenue has more than tripled in about a year and a half, profit per share has rocketed from single digits toward a projected $30-plus, and the stock is up more than 300% over the past year. By any measure you pick, this is a company growing like a rocket. And yet, even after that monster run, it still trades with a Forward P/E ratio of around 8. Read that again! This is a business compounding profits at triple-digit rates, but at a FRACTION of its Dot-com peers. This is NOT what a bubble looks like.
2. SNDK (SanDisk) is a pure-play NAND flash maker spun out of Western Digital in early 2025; it’s barely a year old as a standalone standalone stock. Has its stock price run up been crazy? Oh yea. From 2025 until now, the stock has skyrocketed roughly 4000%. BUT, its revenue ramp up has been just as explosive: fiscal Q3 revenue came in at $5.95 billion; that’s up 97% sequentially, with the datacenter segment up 233%. Management guided Q4 revenue to $7.75–8.25 billion with non-GAAP EPS of $30–33. That means that profit margins flipped from a net loss to +61% in one year. By the way, SNDK’s Forward P/E? Around 12x. Once again, that is NOT a bubble.
Takeaway: if the AI darlings like NVDA and memory stock profits continue to prove durable over the long haul, these stocks aren’t expensive, they’re arguably some of the cheapest growth stories in the entire market. Finally, we’re NOT saying a crash isn’t possible. The rest of the market isn’t experiencing explosive revenue generation. The macro economic environment is uncertain. But the good news is that much of the herd mentality is based on fear. And guess what? Fear sells. It produces clicks. So let’s base our decisions on facts, not the herd.
A WORD FROM OUR CEO
We had a slow start to the week keeping a heavily hedged portfolio and rode out the downtrend until we saw things pick up and finished the week strong. We are currently 43% above the market on an annualized basis, with a 57% win rate against SPY benchmarks.
Our short intro + learning videos get you up to speed on how best use our letters and app to increase your wins.
Back to our usual stream schedule this week 5/26 at 11 AM ET and 5/27 at 3 PM ET
Track all of your investments in real time with our app. Prospero’s proprietary AI tech updates key options signals like Net Options Sentiment, Upside and Downside every 3 minutes.

MEMORY LEAK?
Market/Macro Update w/ Cap/ Value Analysis
QQQ and SPY Net Options Sentiment
Sector Analysis
How we view the Sector performance and momentum
Portfolio Strategy
Putting it all together to make a portfolio that first controls for risks but also has upside
Longs
Adds —> Keeps —> Drops
Shorts
Adds —> Keeps —> Drops
Portfolio Summary
CAP / VALUE ANALYSIS
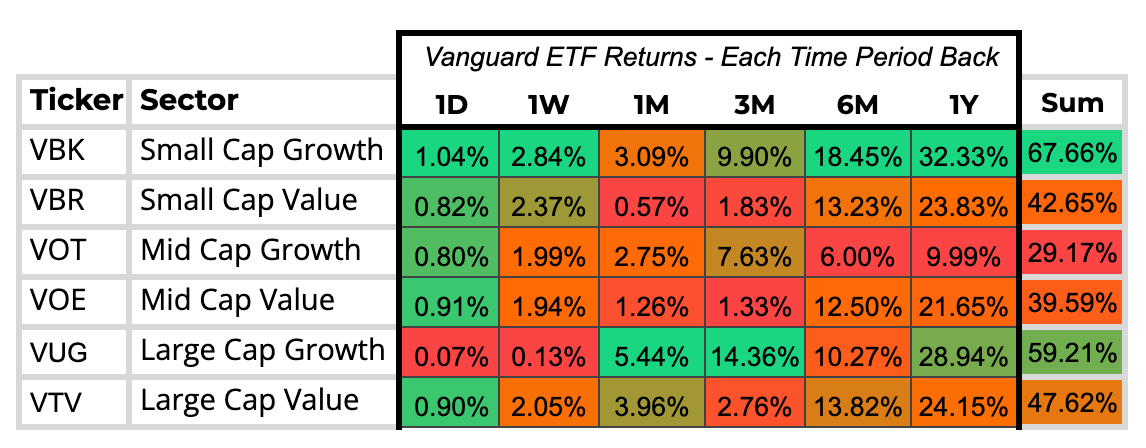
The script has completely flipped this week! When you look at the 1-month data, Large Cap Growth has been the undisputed king of the board. However, zooming into the 1-week data paints a completely different picture. Large Cap Growth practically flatlined, barely eking out a 0.1% gain while capital aggressively rotated down the market cap ladder.
Small Cap Growth led the charge this week, surging nearly 3%, while Small Cap Value, Mid Caps, and Large Cap Value all posted solid, broad-based gains of around 2%. After a massive monthly run in the mega-cap names, it is clear that investors took a breather this week, opting to spread the wealth and actively rotate capital into smaller, higher-beta plays to catch the upside.
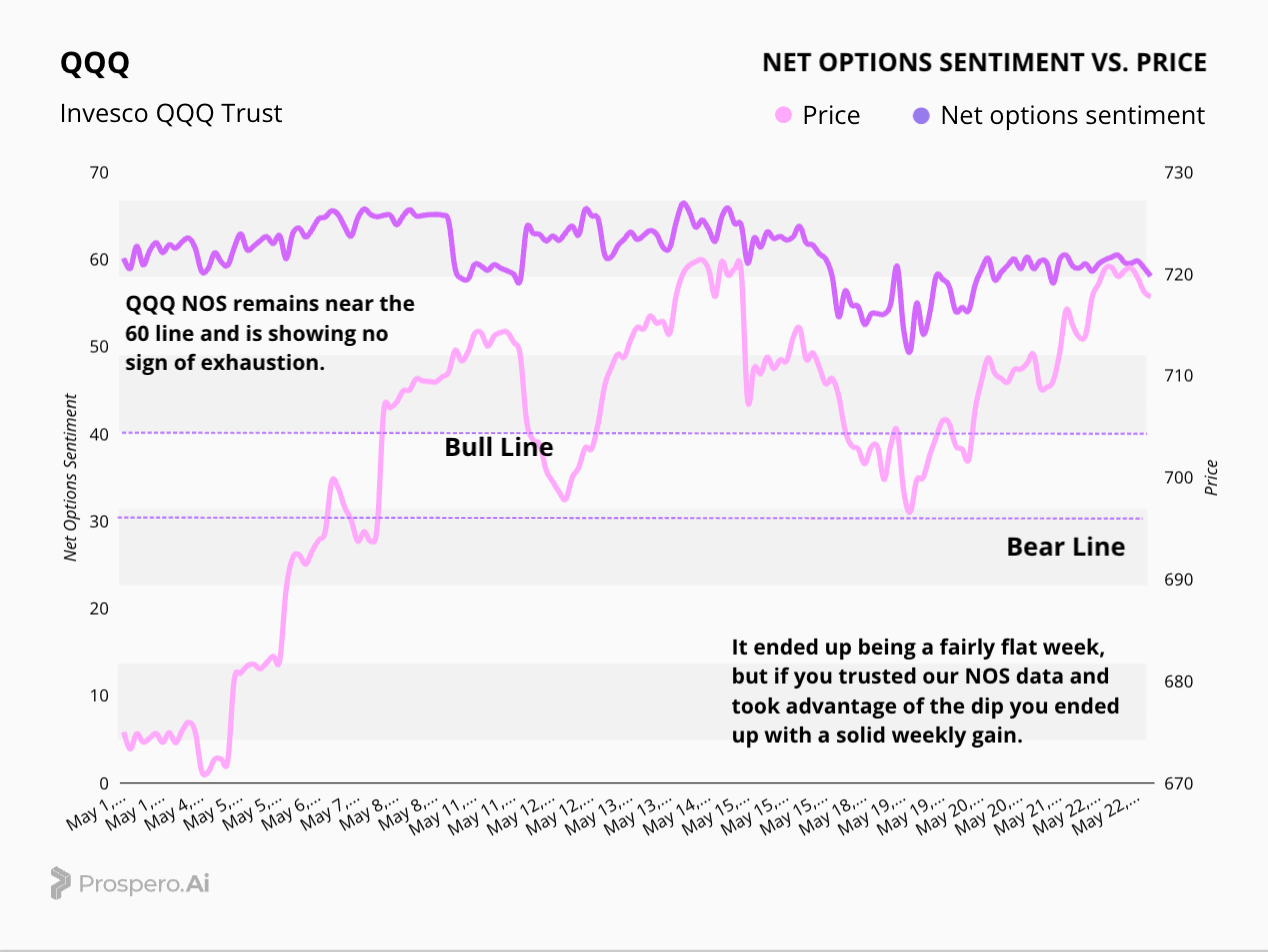
Looking at the QQQ chart, price action ended up being fairly flat for the week, but the underlying data tells a much stronger story. Net Options Sentiment has remained incredibly resilient, holding right near the 60 line and showing absolutely zero signs of exhaustion. If you trusted the NOS data and took advantage of the mid-week dip, you ended up walking away with a solid weekly gain. As long as sentiment stays safely elevated in this bull territory, we remain highly confident in the underlying strength of the tech rally.
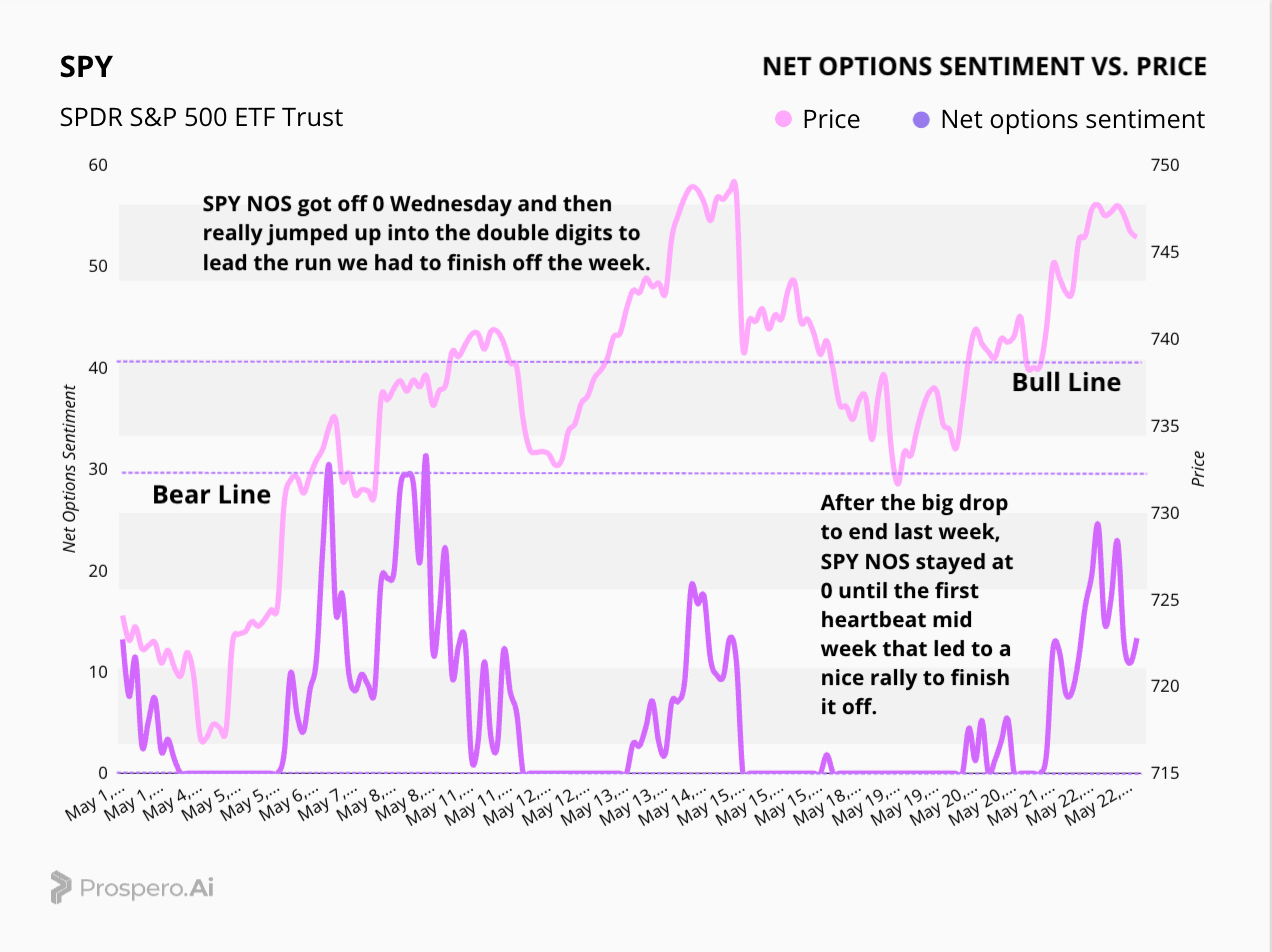
After taking a massive hit at the end of last week, SPY Net Options Sentiment spent the first half of this week completely flatlined at the zero line. However, we finally saw a heartbeat on Wednesday as sentiment suddenly woke up and surged back into the double digits. This rapid influx of bullish options flow acted as the perfect catalyst, dragging the ETF's price right up with it and fueling a powerful rally to finish off the week strong.
SECTOR ANALYSIS
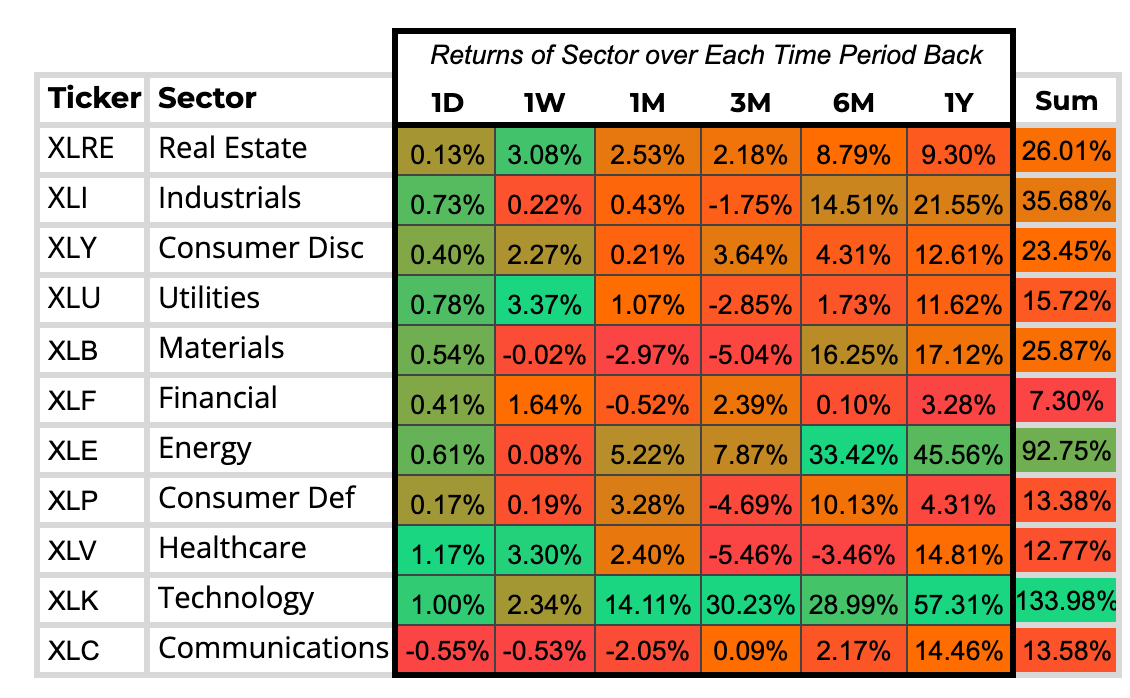
Looking at the 1-week data, we saw a notable shift in market leadership. While large caps took a well-deserved breather this week, the broader Technology sector remained impressively resilient, holding its ground and proving that the underlying tech momentum is still firmly intact. However, it was other sectors that really stepped up to take the reins, catching the overflow of capital as investors actively looked for fresh upside outside of the usual mega-cap heavyweights.
PORTFOLIO STRATEGY
QQQ Net Options Sentiment remains strong, but we have a lot happening Macro wise in the Middle East and elsewhere, so we are maintaining a more neutral stance and trimmed portfolio. We are still leaning bullish with 3 longs and 2 shorts.
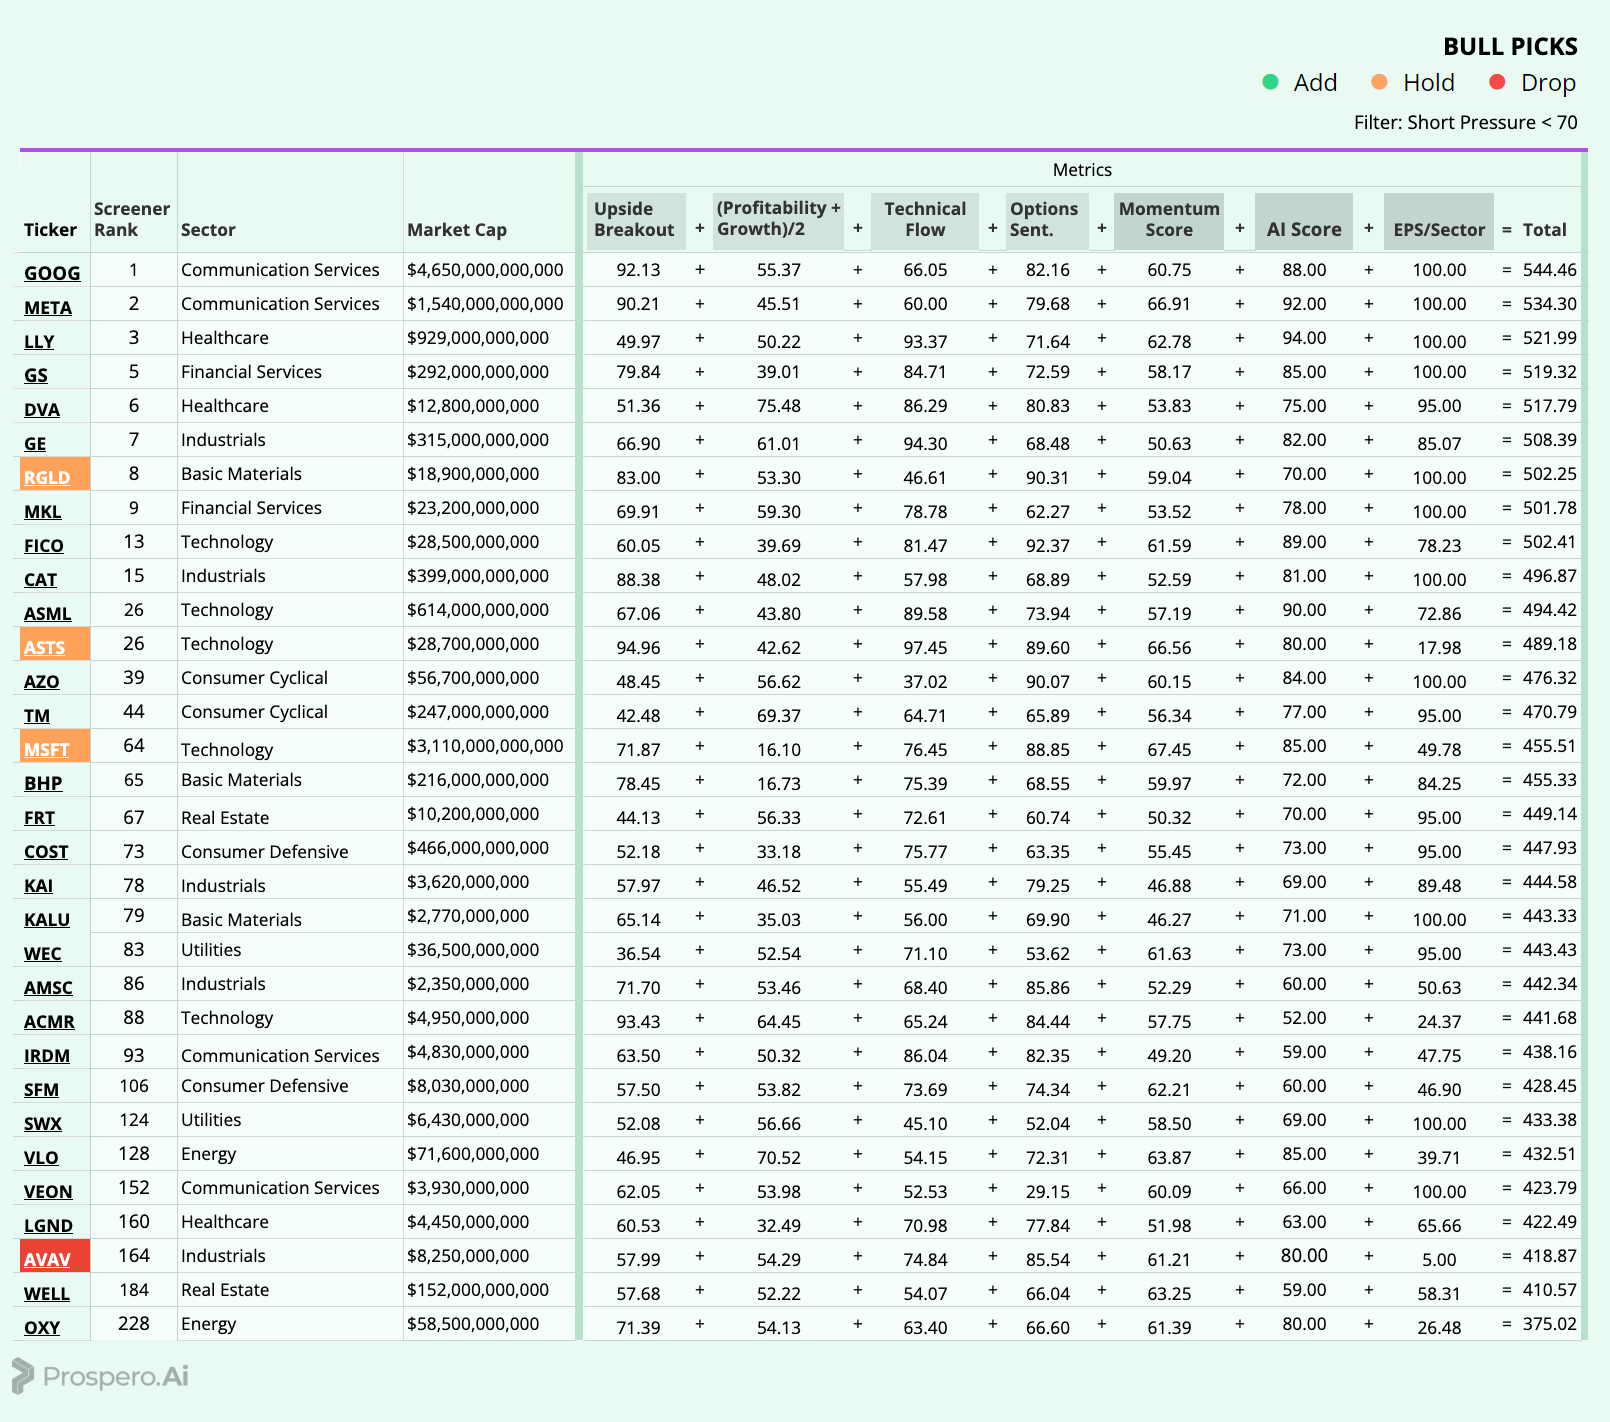
Long / Bull Moves – MSFT, RGLD, ASTS Holds / AVAV Drop
Adds
None
Holds
We’re sticking with most of our longs, MSFT is a safe haven and showing strong Net Ops, ASTS with great upside and Tech Flow, and RGLD continues to rank highly in our screener with high Upside and Net Ops.
Drops
AVAV was dropped as it ranked poorly in our screener overall.
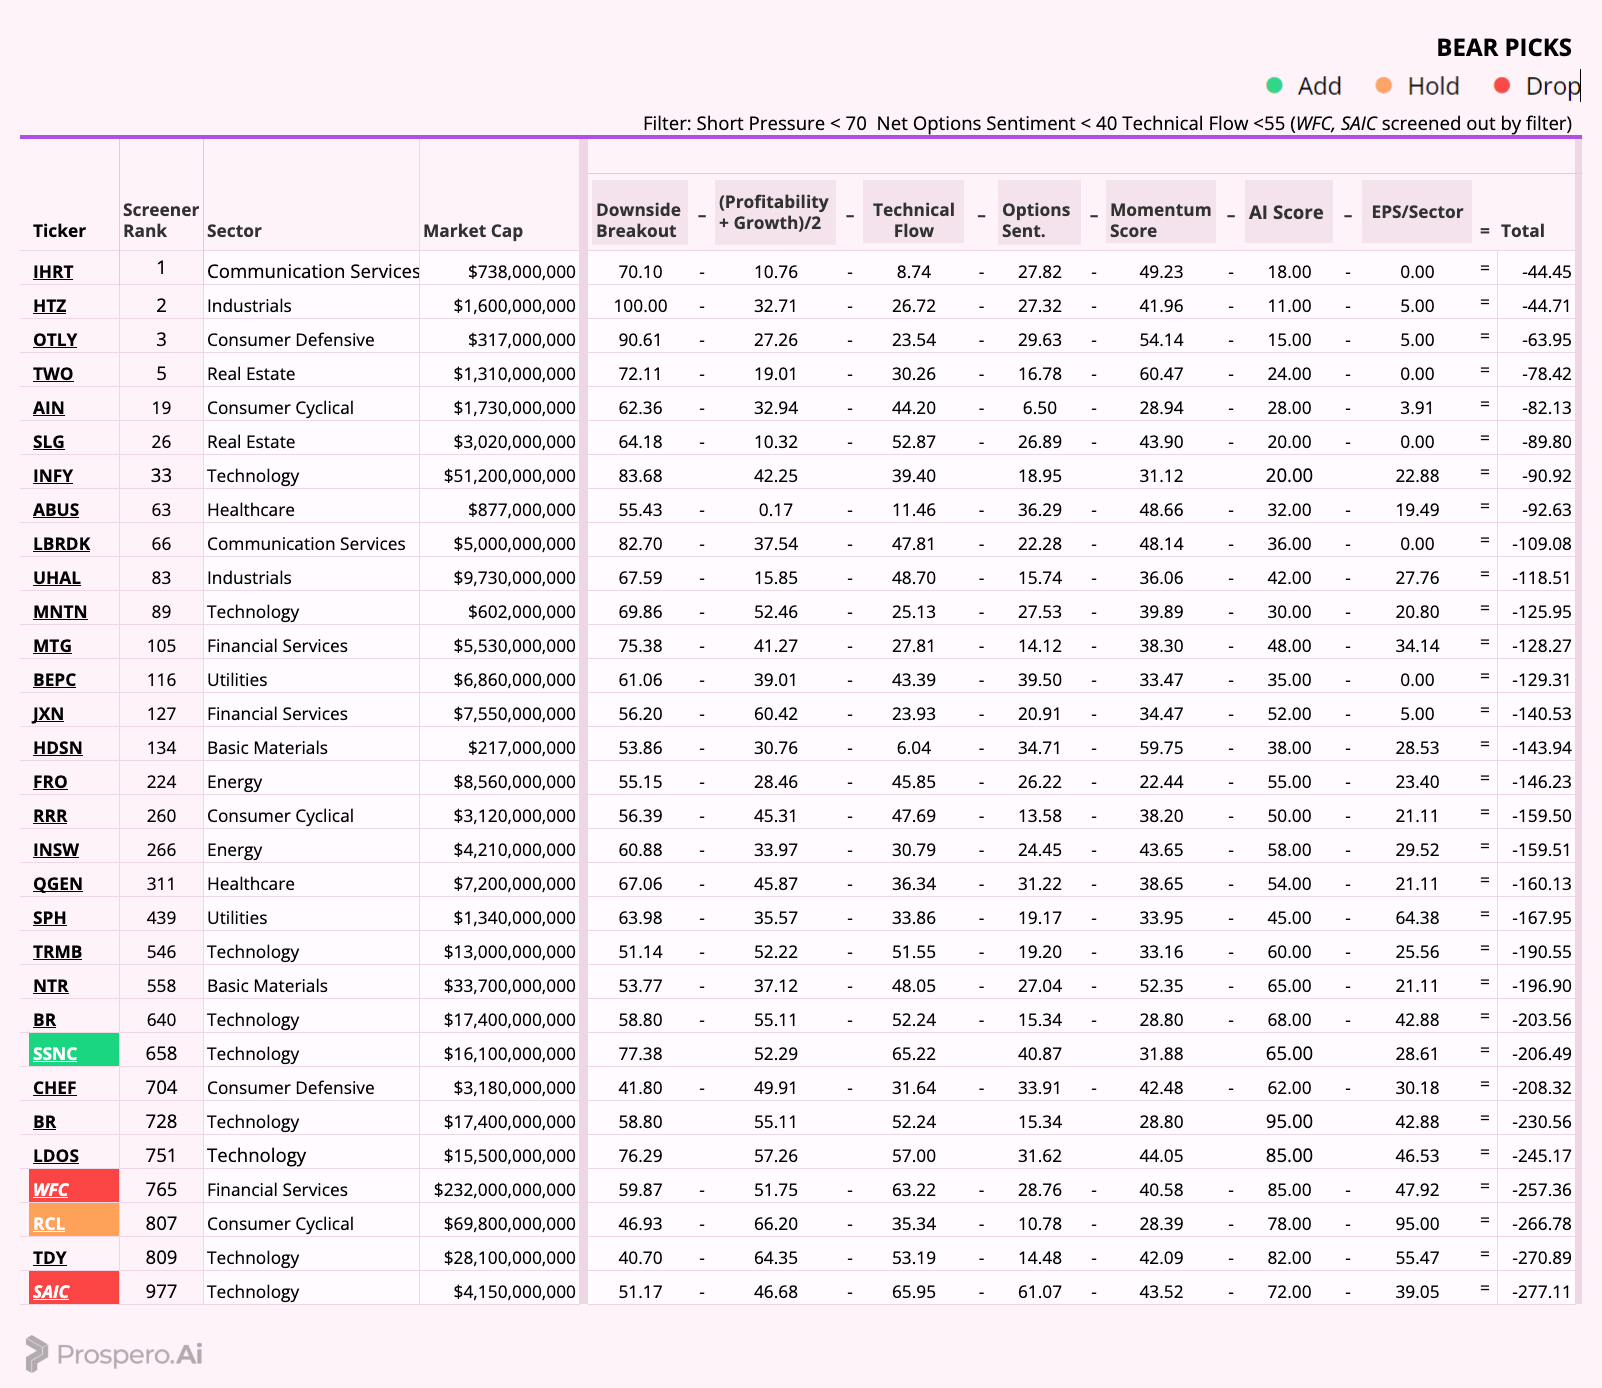
Short / Bear Moves – SSNC Add / RCL Hold and WFC, SAIC Drops
Adds
SSNC was added for its high downside.
Holds
RCL was held for its poor Net ops and Momentum scores.
Drops
WFC and SAIC scored poorly in our screener and were filtered out for having higher Net Ops and Tech scores.
Portfolio Summary
Long / Bull Moves – MSFT, RGLD, ASTS as holds / AVAV drop
Short / Bear Moves – SSNC Add / RCL hold / WFC, SAIC as drops
3 Longs: MSFT RGLD, ASTS
2 Shorts: RCL, SSNC

 | A guest post by
|