

No Margin For Error
07/05/26 Prospero.ai Investing - 333rd Edition (Weekend)


There’s a scene in the movie Margin Call, where a junior analyst stays late at the office working on a risk model for his firm and discovers the terrible truth: the firm is holding so much leveraged risk that a small dip in the market would produce losses bigger than the entire company was worth. Nobody broke the rules. Nobody did anything illegal. They just kept borrowing and betting until the math quietly turned lethal. When the Market Grim Reaper came knocking, it was a blood bath. But something just happened about a month ago that makes that scenario plausible, except on a much larger scale. Let me explain…
Almost exactly one month ago, one of the biggest changes in stock market history happened and very few people are thinking about the potentially seismic implications.
The massive shift actually began a few years ago when retail traders started getting access to brokerage accounts like Robinhood and Webull skyrocketed. Before 2020 retail order flow rarely topped 10% of daily equity trading. By April of 2025, that number hit as high as 36%. But there was ONE rule that held an absolutely title wave of retail trading back. It was the rule that you had to have at least $25,000 in your account to have unlimited day trades. And the overwhelming majority of retail traders had less than $25,000 in their account. That VASTLY restricted the amount of trades hitting the tape on any given day. On June 4th, that rule just got lifted. Now all it takes is $2,000 to have UNLIMITED day trades. That sounds like a small, boring regulatory footnote. It isn’t.
Out of roughly 27 million total Robinhood accounts, the average account balance was around $4000. FINRA’s data suggest that only 2.4% of all traders had accounts of $25,000 and could therefore have unlimited trades. The craziest part? According to theglobeandmail.com reported that Robinhood’s margin balances hit $18 Billion in April, that’s a $114% increase year over year; and that was BEFORE the day trading rule change (more on that subject in a minute.) All the numbers aren’t in, but Robinhood announced that June was their highest traded month ever, and Citadel released their preliminary findings that suggest retail volume could be approaching as high as 45% of ALL daily trading volume. Bottom line: by pretty much every measure, there are more traders, more trades and more money in the market than at any other time in history; that’s not debatable. What IS debatable, is the impact on all this volume and liquidity on the system.
We’re a bit concerned. Here’s why…
The market just finished one of its best first half in years. With the surge of investors that now have unlimited trades, margin debt (that’s money investors have borrowed from their broker to buy more stock than their cash alone would allow) just hit an all-time record. Over $1.4 trillion. As a share of the entire U.S. economy, borrowed money in the stock market is sitting at roughly 4%, nearly three times its long-run average.
Here’s why that number matters: every major market top in the last hundred years (1929, 1987, 2000, 2007, 2021) showed up wearing the exact same outfit. Margin debt hit a new record, and then it started to roll over. The concerning part is that the record got broken back in April, BEFORE day trading rule changed. Now, on top of an already record amount of borrowed money, we just lowered the door to let more people in. A $2,000 account can now trade with real leverage, in real time, all day long. The guardrails are gone.
Why This Could Get Ugly Faster Than Usual
Here’s the mechanic you need to understand, because it’s the whole ballgame: when you buy stock with borrowed money and the stock drops, your broker doesn’t wait around. They force you to sell to cover the loan (aka ‘Margin Call’). That selling pushes the price down further, which trips the next guy’s margin call, which forces more selling. It’s a snowball, and it only rolls downhill.
Under the old rules, that snowball usually started at the end of the trading day, when accounts got checked. Under the new rules, your risk gets checked all day long, in real time. That means the forced selling can start mid-morning instead of at the closing bell. Faster trigger, faster snowball.
And who just got handed the keys of this Ferrari of a market? Every 19 year old with $2000 and a margin account. That means there’s now more fuel, more triggers, and a WHOLE lot more drivers with less experience behind the wheel. That’s not a combination that produces a gentle pullback. History says it could produce a violent one.
The Positives
To be fair, there’s a real case for the other side. More people trading generally means more money moving through the system, which can push prices higher and keep a rally going longer than the fundamentals alone would justify. The new real-time risk checks are, in theory, smarter than the old blunt $25,000 rule — they catch trouble earlier instead of waiting until the next morning. And measured against the size of the whole stock market rather than the size of the economy, the amount of borrowed money out there isn’t wildly out of historical range. The bull case says we’re not yet at 2007 or 2000-level distortion.
Now Add a Softening Jobs Picture
Here’s where it gets more serious. The June jobs report came in weak — just 57,000 jobs added, about half of what was expected — and the two prior months got revised down by a combined 74,000 jobs on top of that. The unemployment rate actually ticked down to 4.2%, but not because more people found work. It dropped because 720,000 people simply stopped looking for a job and left the workforce altogether. That’s not strength. That’s the kind of number that looks fine on the surface and is softer underneath.
So picture the full setup: record borrowed money in the stock market, a wider door for less experienced traders to use that leverage, a market already up huge for the year and priced for perfection, and now real cracks showing up in hiring. None of those four things on their own is a five-alarm fire. Stacked on top of each other, they’re the kind of combination that’s shown up right before some of the worst stretches in market history.
What We’re Watching at Prospero
Our Net Options Sentiment score which tracks how Big Money is actually positioning their money, not just what they’re saying sitting near record low right now. That tells us professional money is quietly buying protection and hedging hard, even while the headlines stay upbeat and the indexes keep hitting new highs. When the smart money is building a floor of protection under the market while the crowd is still buying on margin, that’s usually a signal worth respecting.
This isn’t a call to panic or to get out of the market entirely. It’s a call to play defense. That means being honest with yourself about how much leverage you’re actually carrying, keeping some dry powder on the sidelines instead of being fully invested, and having a plan for what you’ll do if this turns fast. The bill for record leverage always comes due eventually. We don’t know exactly when. But when the crowd that’s most levered is also the crowd most likely to run for the exits at the same time, the safest move is to make sure you’re not standing in the doorway with them.
A WORD FROM (Brent) while THE CEO is on vacation
Frustrating week as we started strong and gained some good ground from last week, but got caught by the AI hardware downturn which really hurt our performance to end the week. We will look to move into the sectors that have been strong recently and hedge any Tech exposure as it goes through this volatile period. Our win rate has been very consistent, so we will continue to let our winners run and cut losers quicker when possible. We are currently 20% above the market on an annualized basis, with a 57% win rate against SPY benchmarks.
Our short intro + learning videos get you up to speed on how best use our letters and app to increase your wins.
Monday’s stream 7/6 is at the normal time 11AM. Wednesday’s stream 7/8 also at the normal time 3PM.
Track all of your investments in real time with our app. Prospero’s proprietary AI tech updates key options signals like Net Options Sentiment, Upside and Downside every 3 minutes.

No Margin For Error
Market/Macro Update w/ Cap/ Value Analysis
QQQ and SPY Net Options Sentiment
Sector Analysis
How we view the Sector performance and momentum
Portfolio Strategy
Putting it all together to make a portfolio that first controls for risks but also has upside
Longs
Adds —> Keeps —> Drops
Shorts
Adds —> Keeps —> Drops
Portfolio Summary
CAP / VALUE ANALYSIS
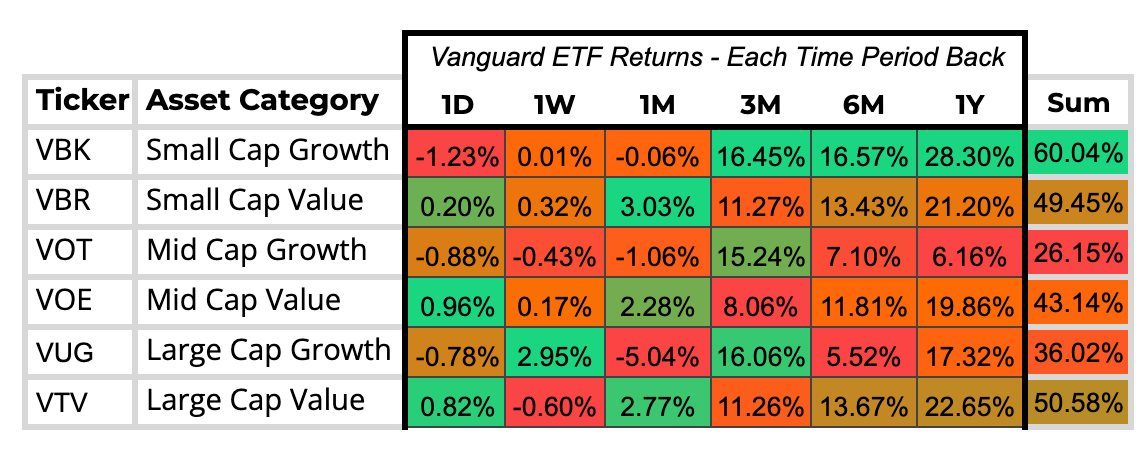
The one-month data highlights a clear shift away from large-cap growth, which dropped 5.0%. Instead, investors moved steadily into value categories across the board. Small-cap and large-cap value both gained 3.0%, while the mid-cap value style added 2.5%. This shows a strong preference for broader value segments over concentrated growth.
The weekly data reveals a quick counter-trend. Large-cap growth attempted a rebound, gaining 3.0% while other market styles stayed mostly flat. However, daily data shows this bounce hit immediate resistance. Sellers quickly stepped in to push growth categories lower. This signals that investors are using short-term rallies to sell their large-cap growth positions rather than fueling a sustained breakout.
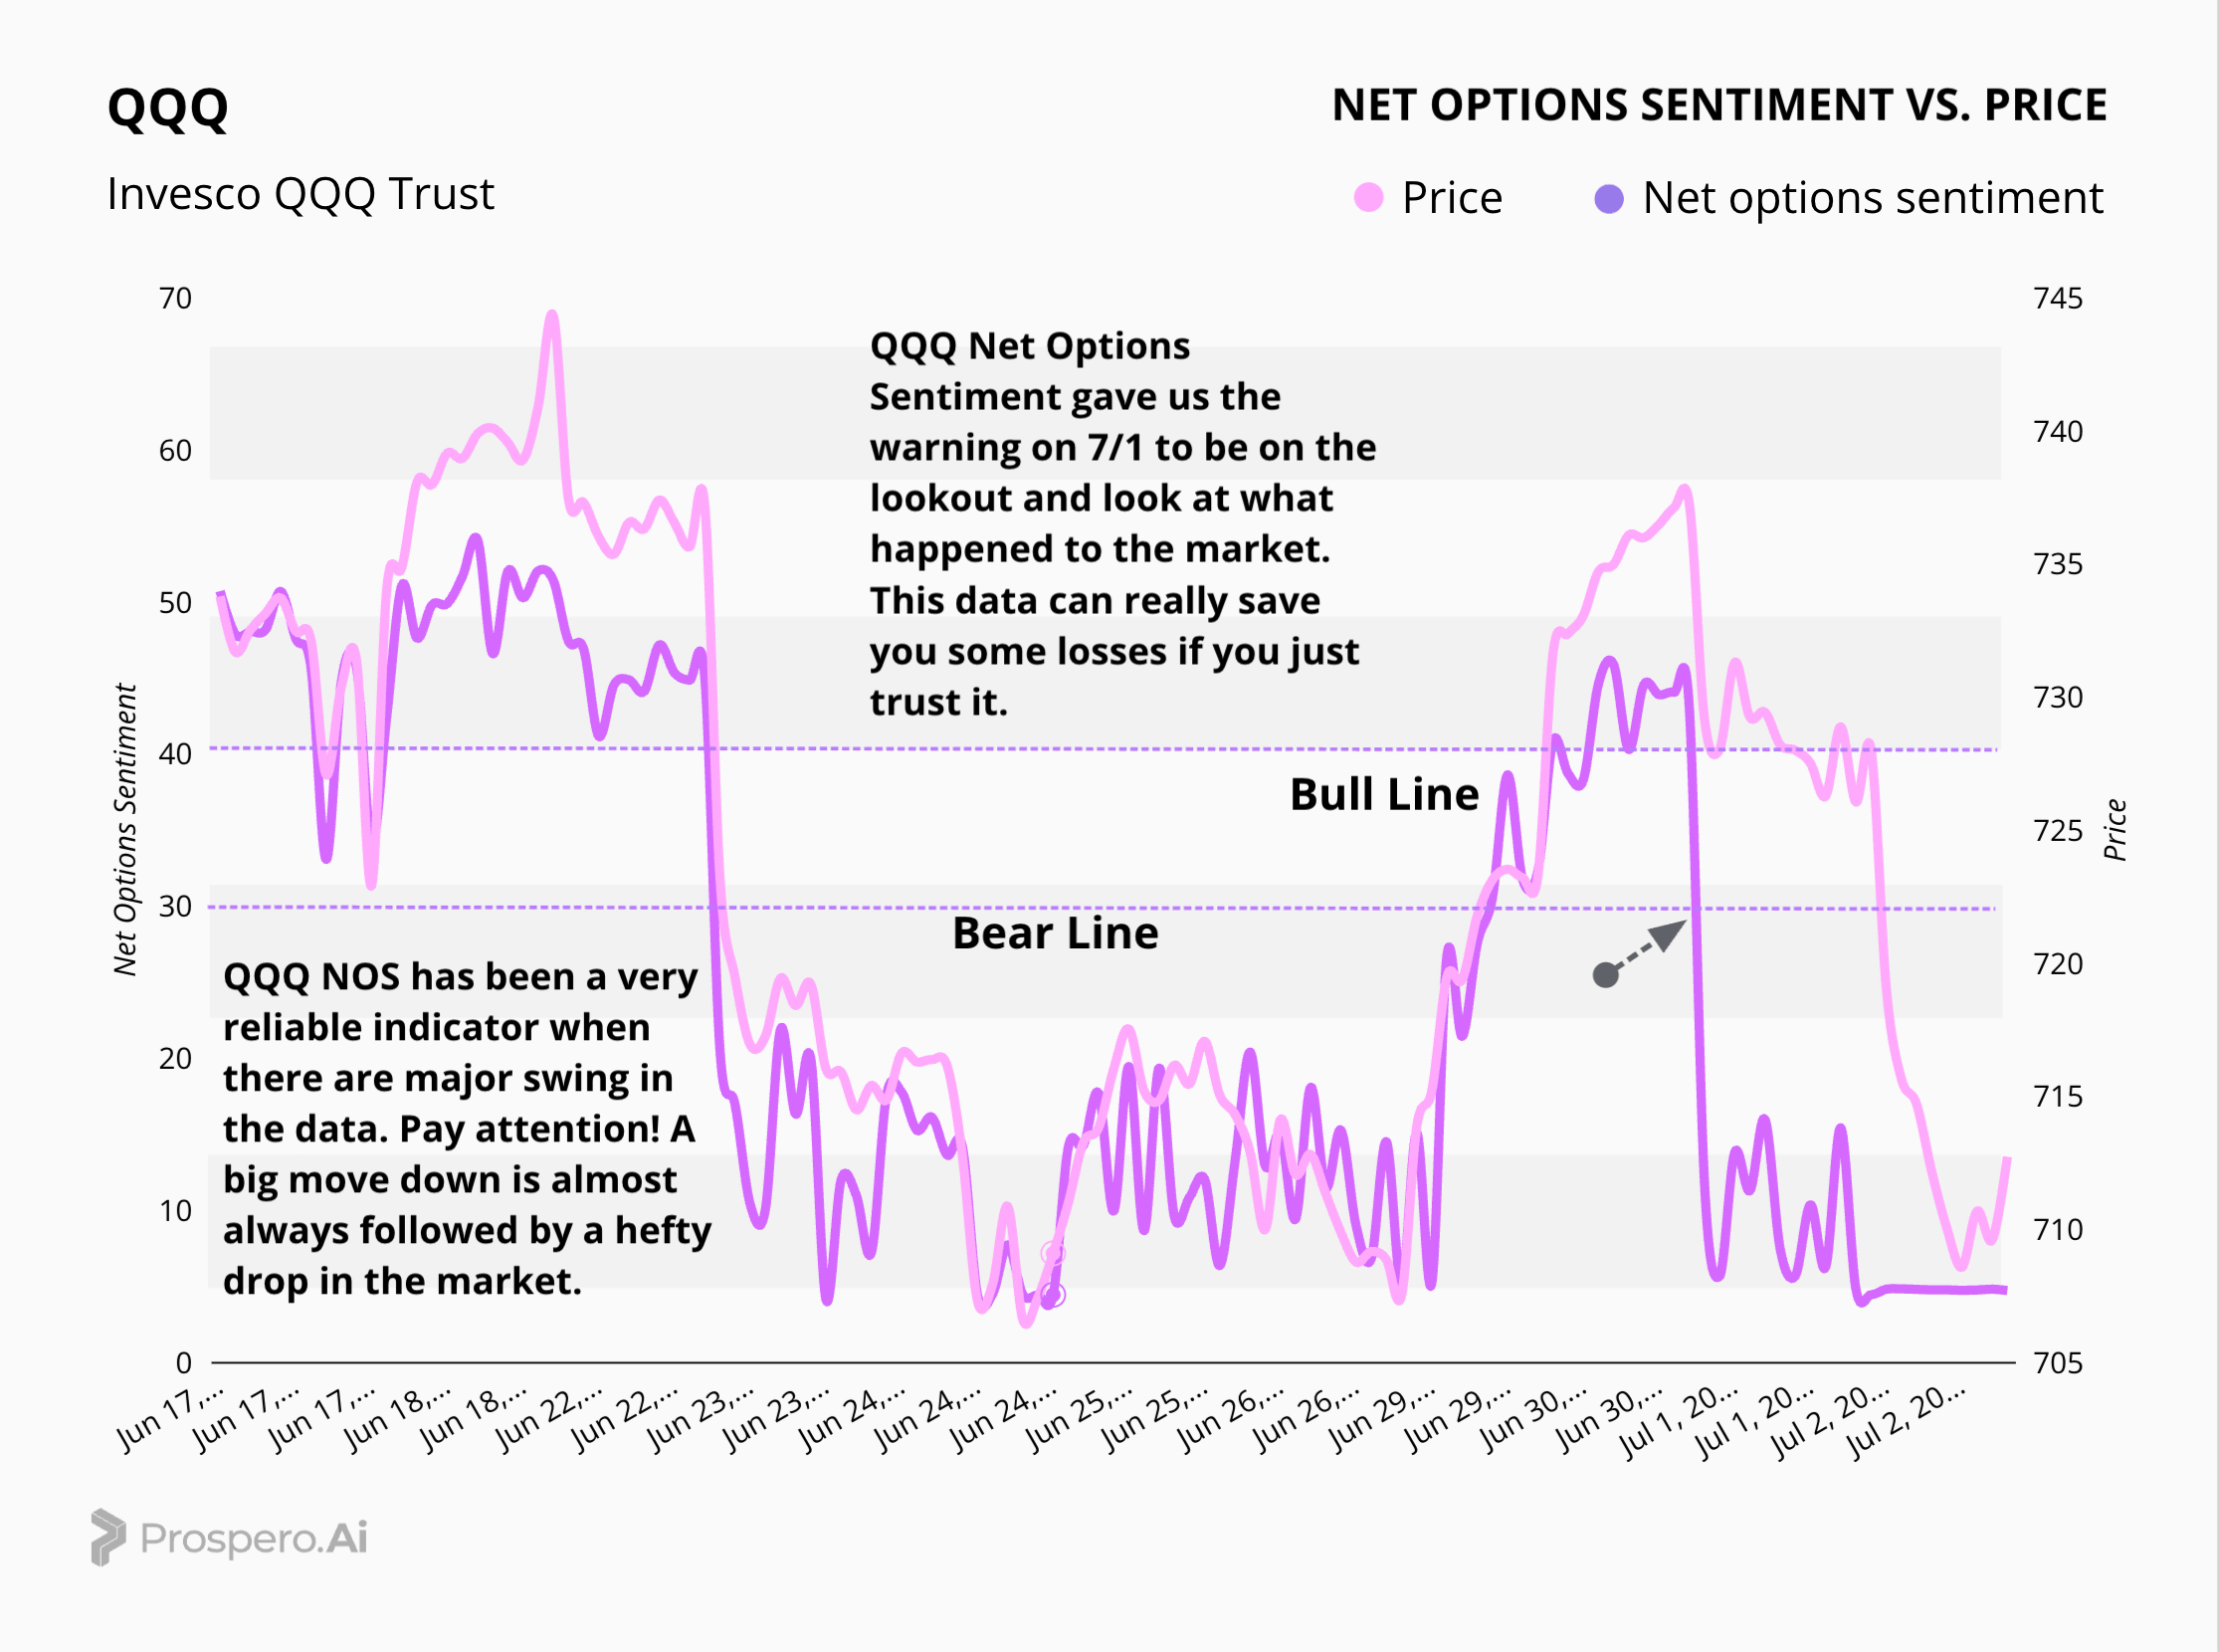
The QQQ NOS chart highlights a clear rejection at key resistance levels. After testing the Bull Line at 40 on July 1st, the metric experienced an immediate reversal, collapsing back toward the 10 level. This rapid degradation in options sentiment served as a highly accurate leading indicator for the subsequent drop in the broader tech market. Until the data confirms a structural shift back above this Bull Line, maintaining a defensive posture regarding tech exposure remains the optimal strategy.
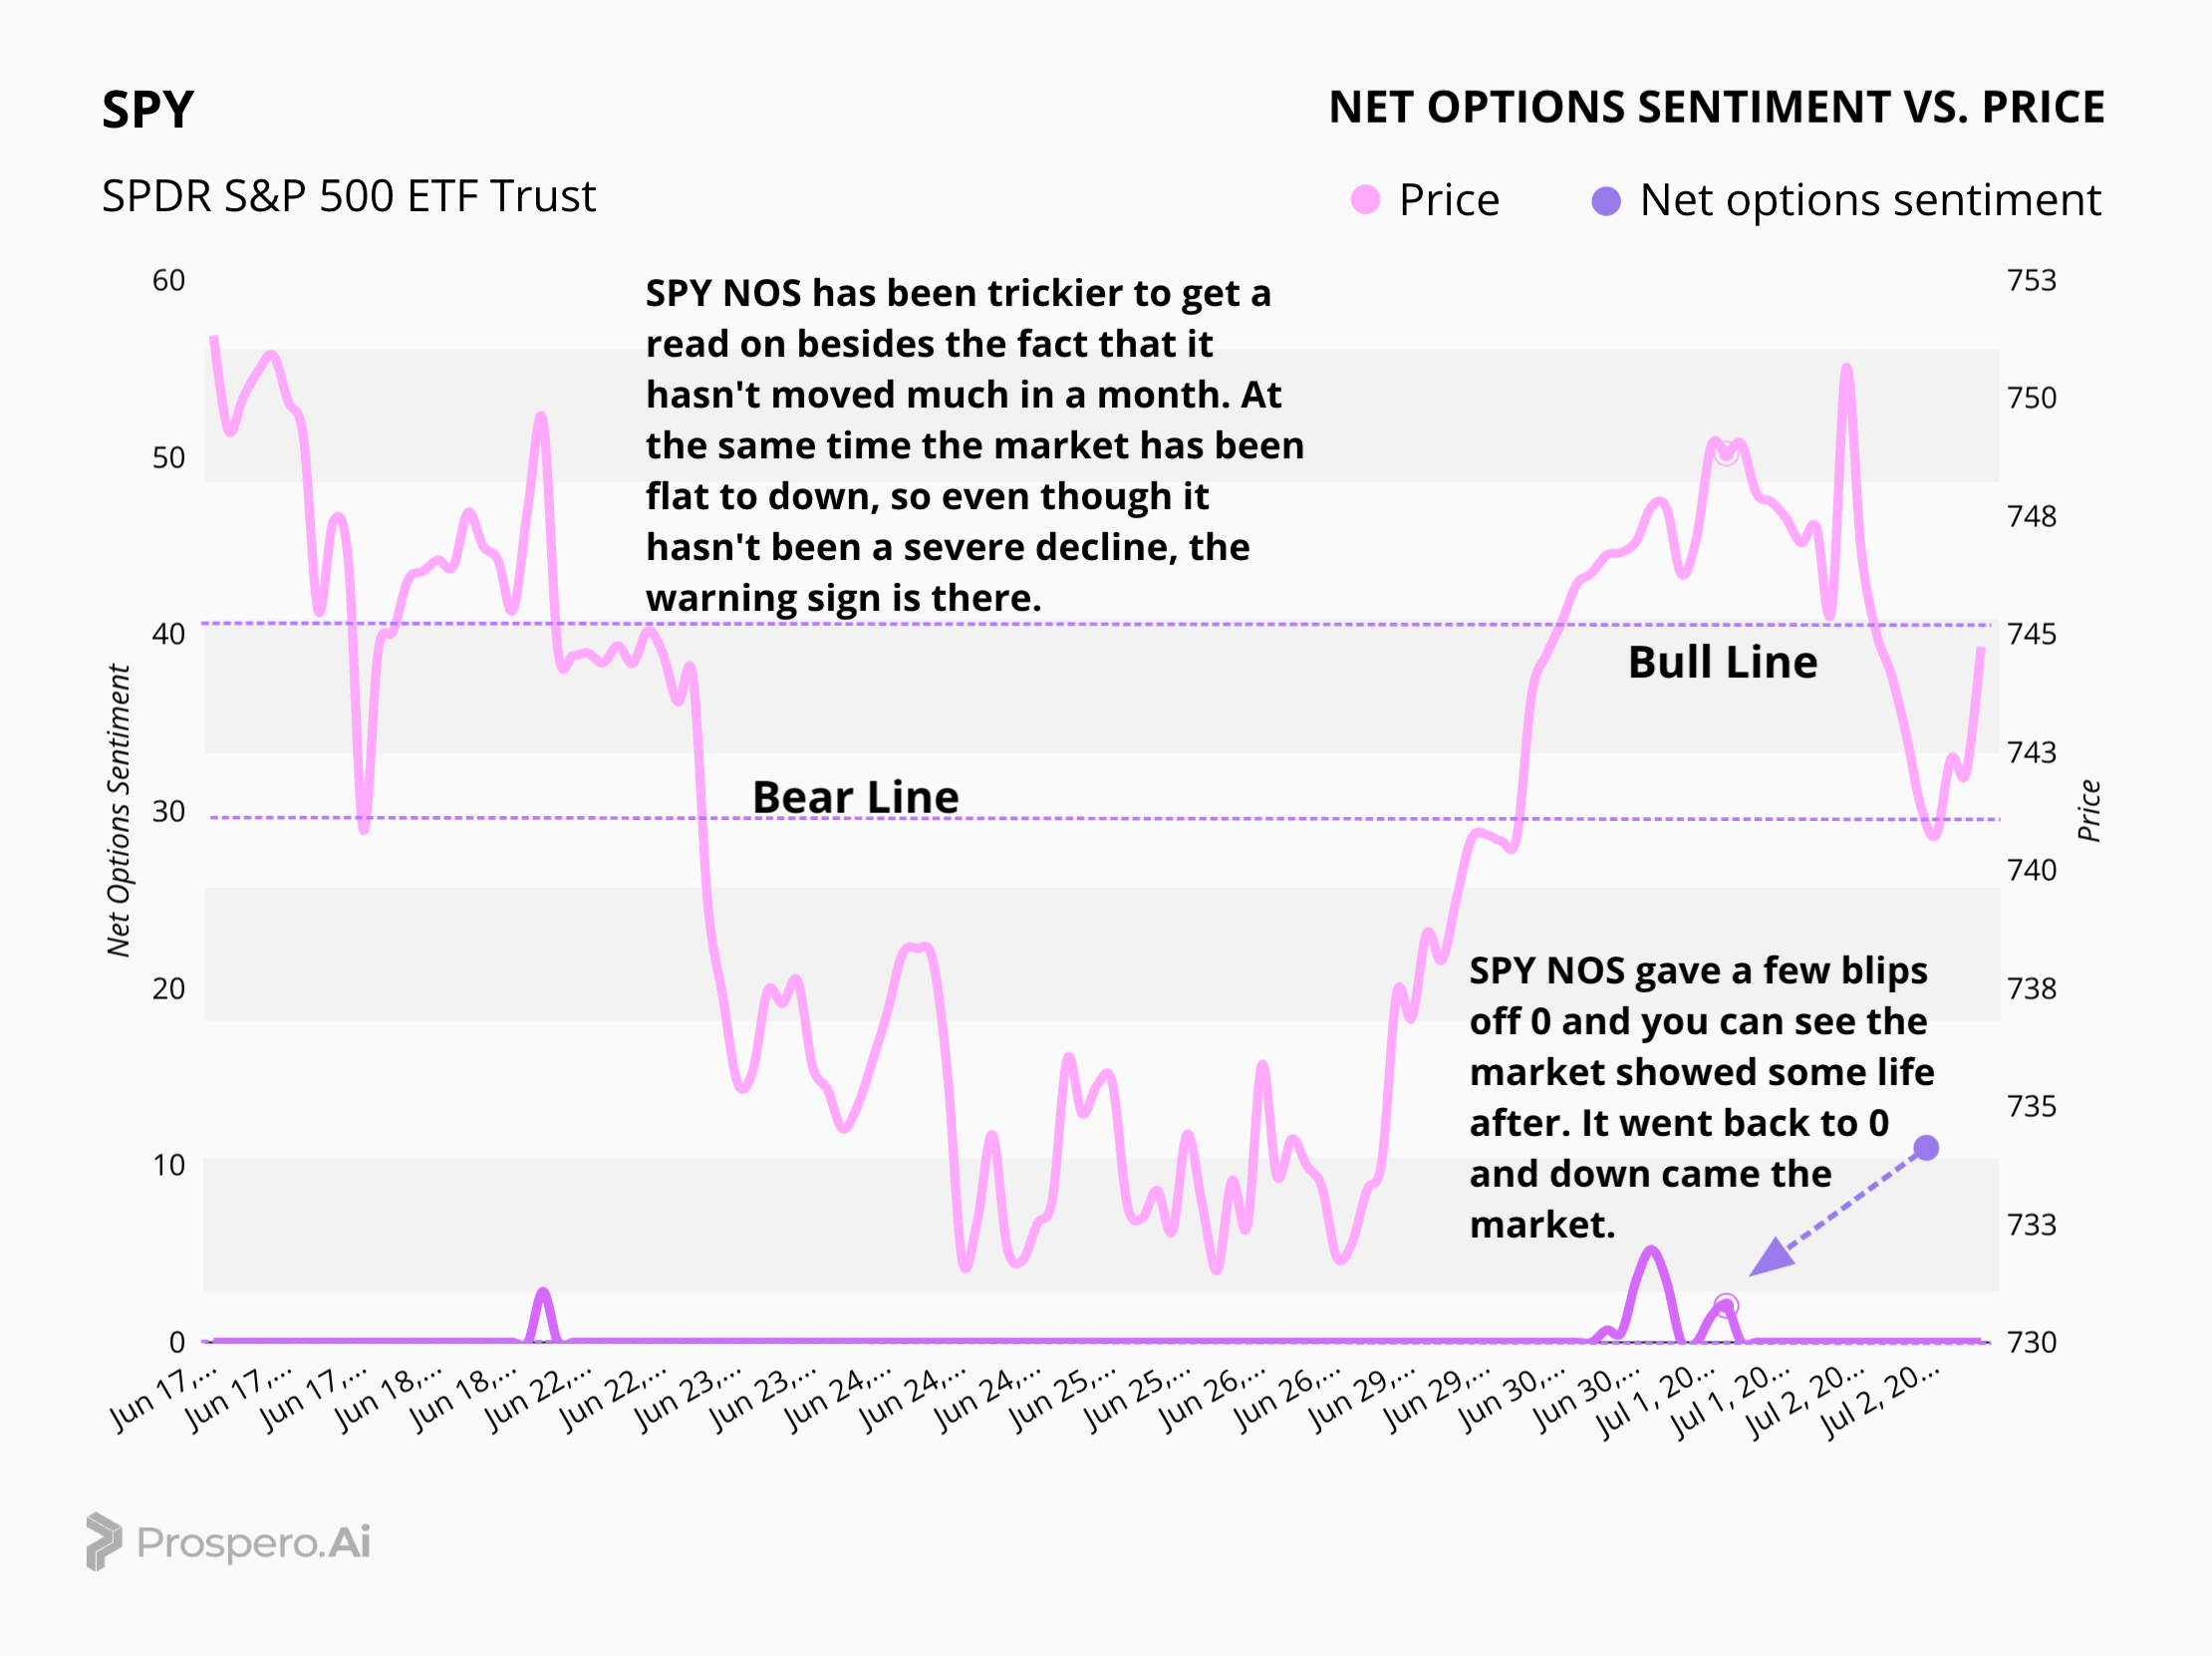
SPY NOS has remained virtually locked at the zero line for several weeks, signaling a definitive shift in broader market momentum. Following this flatline in sentiment, the index has steadily drifted lower, aside from a brief spike driven by geopolitical news. Trusting this sustained defensive data over short-term price action keeps portfolios positioned correctly for the ongoing market cooldown.
SECTOR ANALYSIS
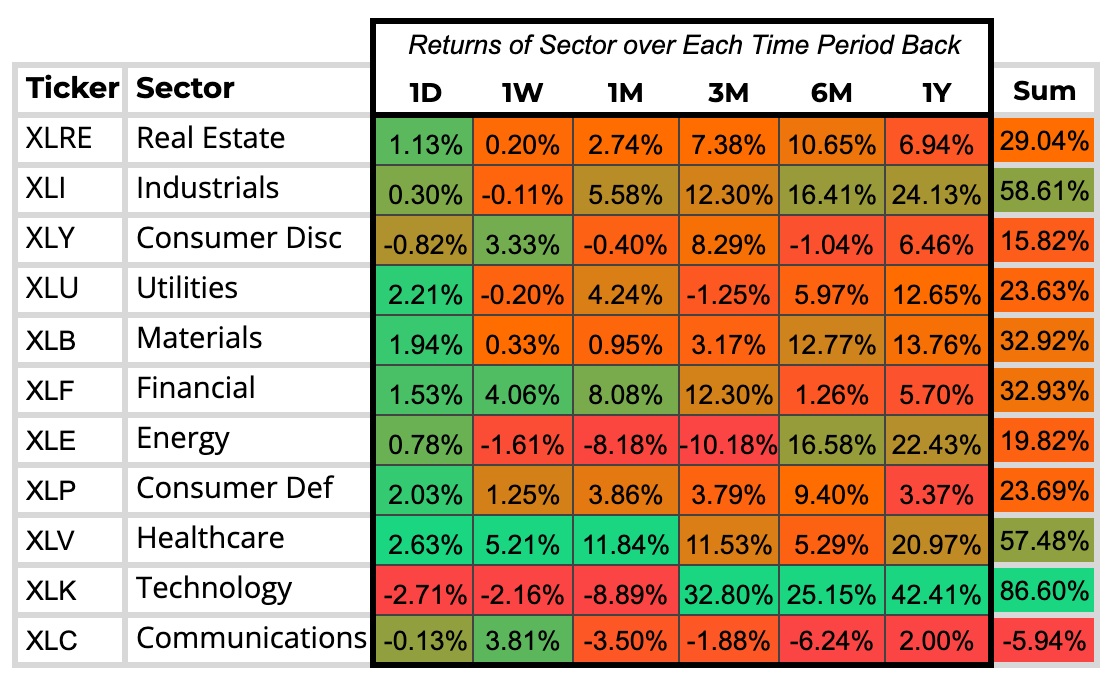
The trailing one-month data reveals a definitive shift in market leadership. Capital has actively rotated out of previously dominant areas, with Technology and Energy experiencing significant contractions of 9.0% and 8.0% respectively. This confirms a sustained period of profit-taking in the most extended pockets of the market.
Conversely, investors are aggressively accumulating positions in Healthcare and Financials. Healthcare leads the market with a massive 12.0% monthly gain and maintained its momentum with a 5.0% advance this week. Financials show similar structural strength, securing an 8.0% monthly return alongside a 4.0% weekly gain. This rotation confirms that institutional capital is finding substantial value in cyclical and defensive areas rather than abandoning the broader equity market.
PORTFOLIO STRATEGY
QQQ Net Options Sentiment has been a concern, and with SPY stuck on 0 we need to be smart with how we are positioned. The entire market isn’t in collapse, so we’re focused on longs that have strong balance sheets and good momentum along with utilizing sectors that have had a strong month while still keeping some higher beta names that have a lot on the horizon. We’re looking to keep hedged with Tech shorts along with names that look bad in our signals. We are starting the week neutral.
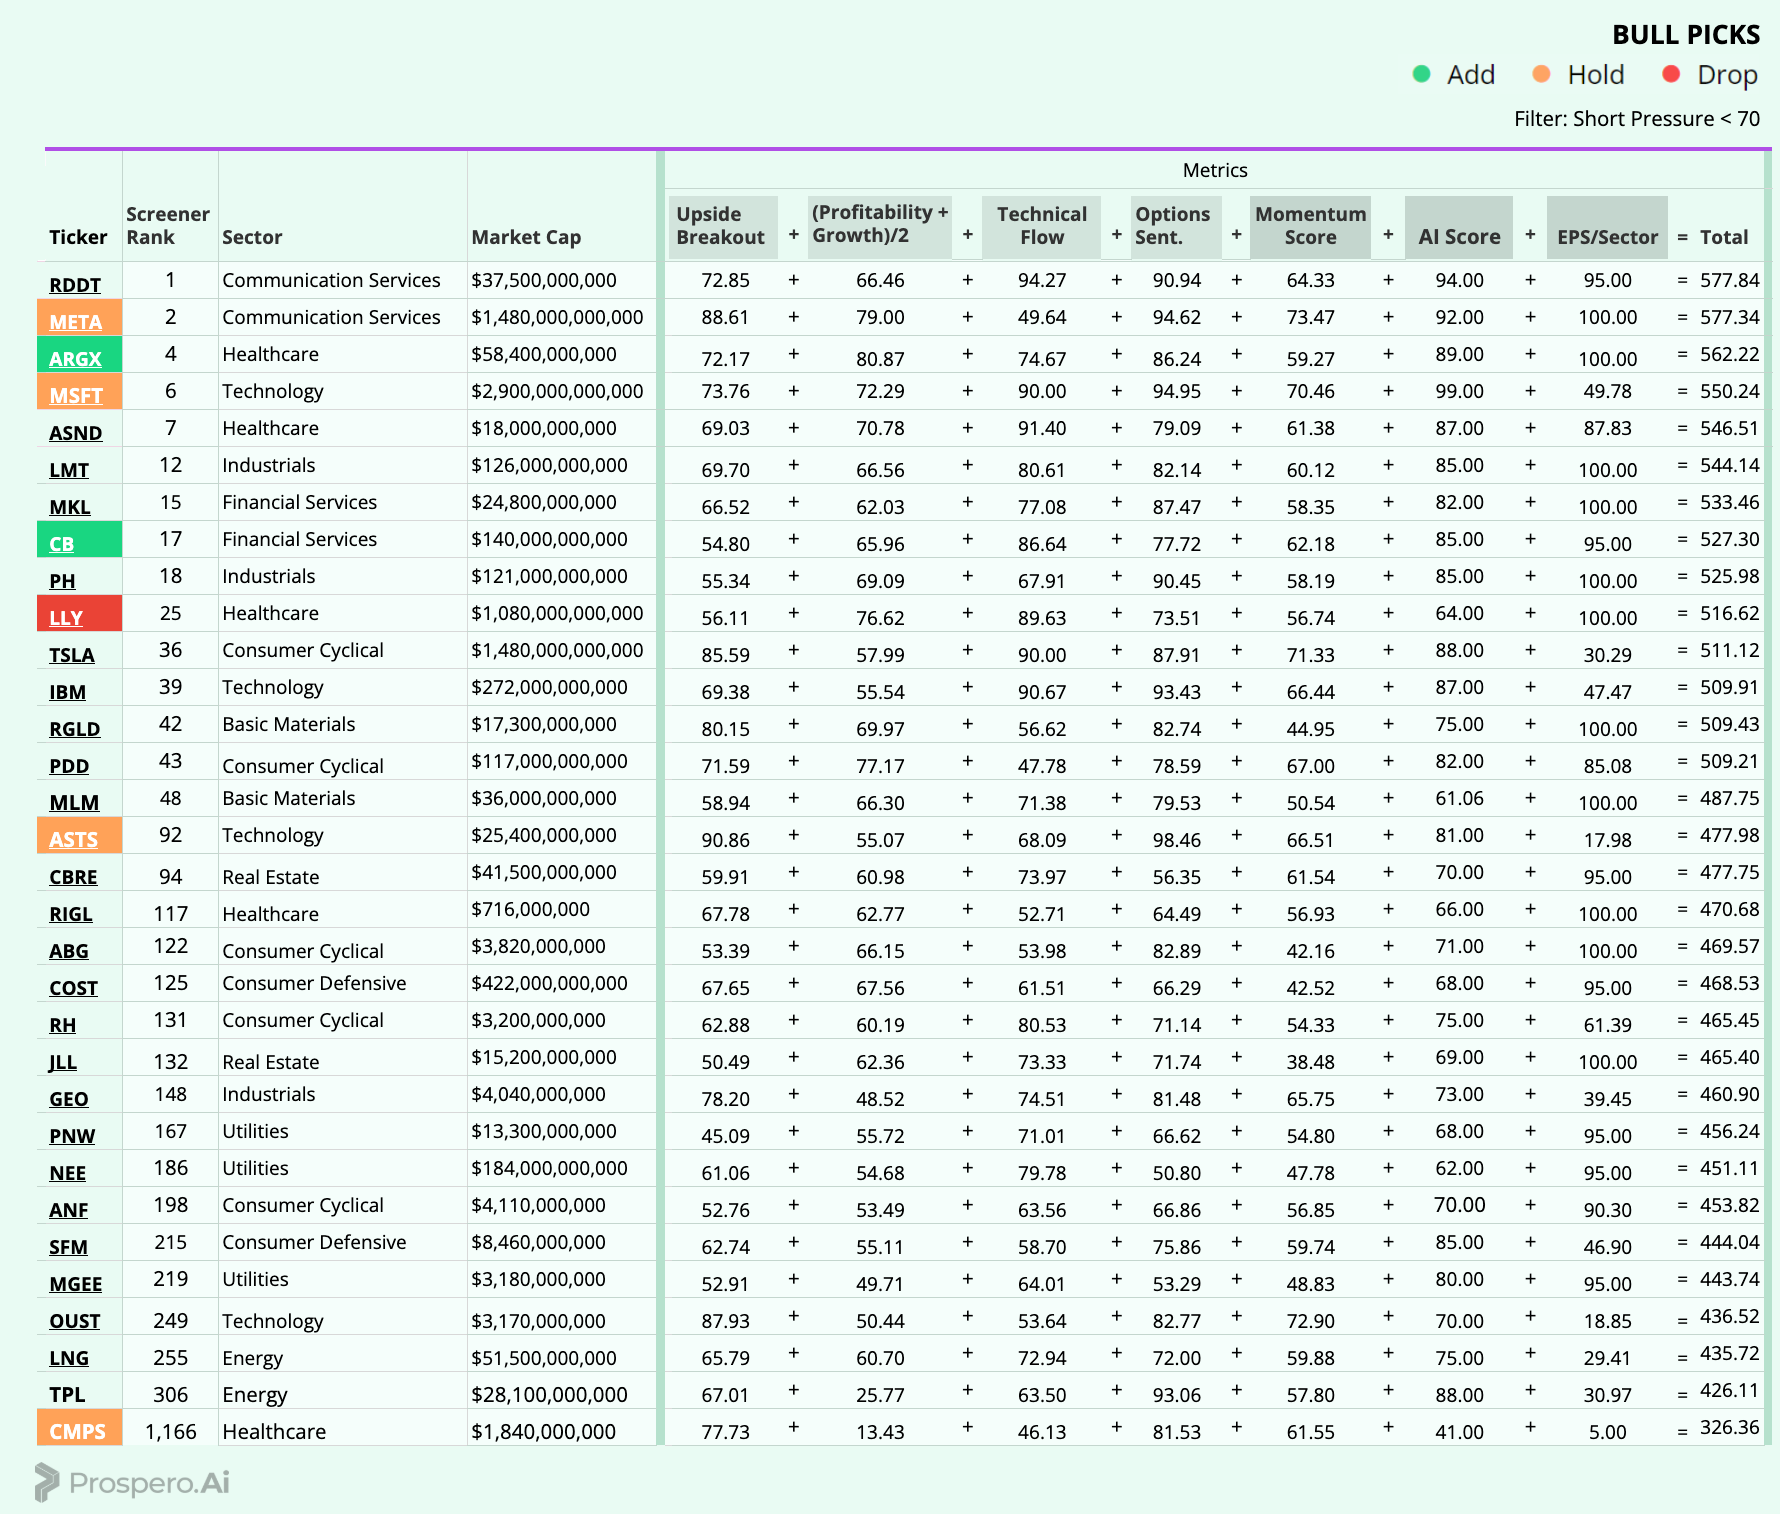
Long / Bull Moves – ARGX, CB ADDS / META, MSFT, CMPS, ASTS Holds / LLY DROP
Adds
ARGX was added for its high Net Ops and AI score in Healthcare and CB was added as a brute in Financial world with high Tech Flow and Net Ops.
Holds
META was held for its high Momentum and Net Ops, MSFT was held for its top of the charts AI score and great Tech Flow, ASTS was held for its high Net Ops and Upside and CMPS was held for the Upside and Net Ops.
Drops
LLY was dropped as it fell quite a bit in our screener with lower upside and AI score.
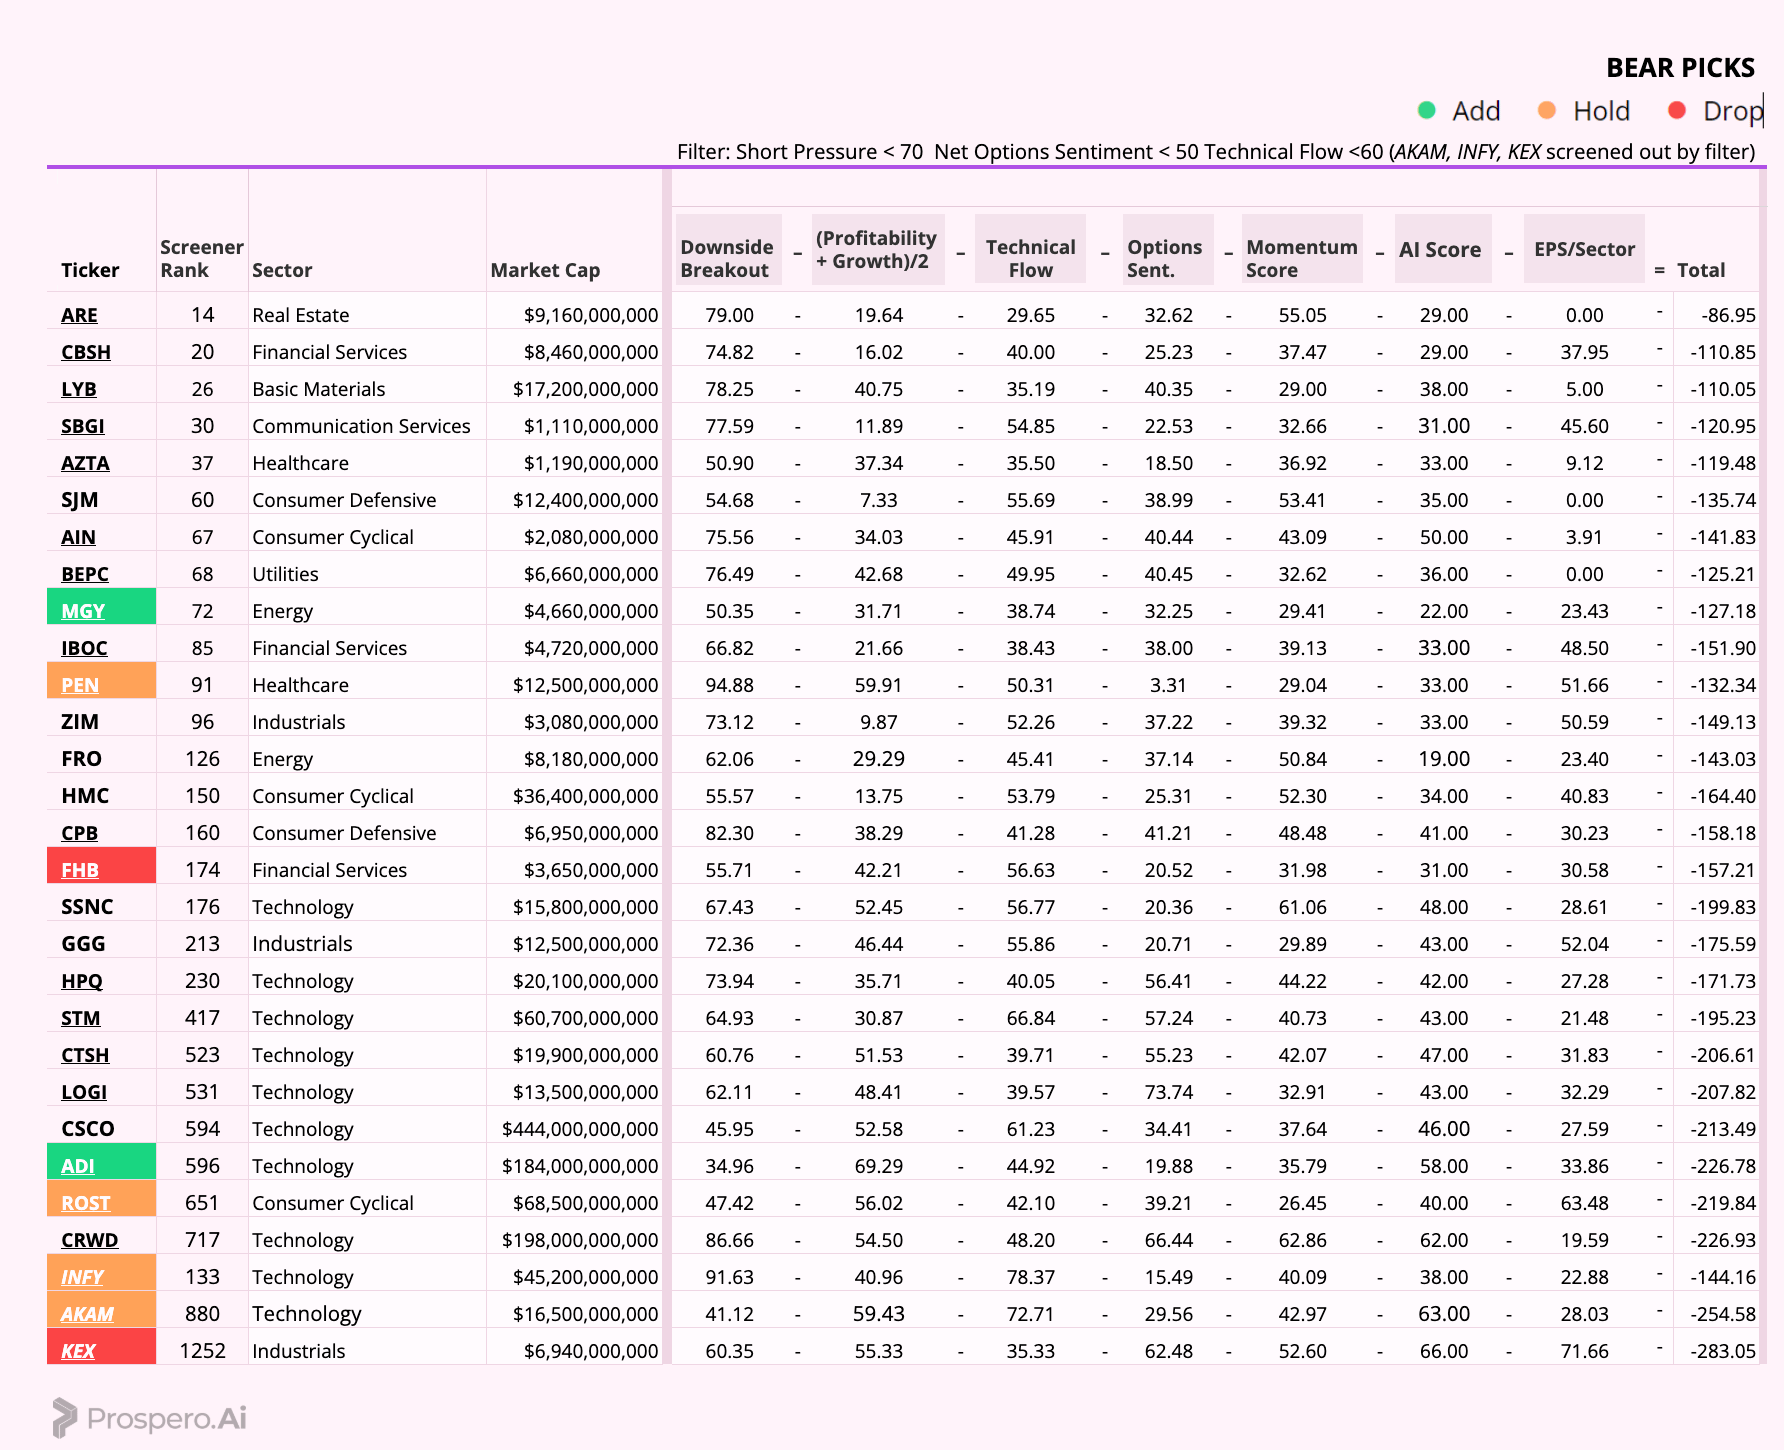
Short / Bear Moves – MGY, ADI Adds/ PEN, ROST, AKAM, INFY Holds / FHB, KEX Drop
Adds
MGY was added for short Energy exposure with its poor Momentum and Net Ops, ADI was added for its low Net Ops.
Holds
ROST was held for its low Momentum and Net Ops scores, INFY was held for high downside and low Net Ops, AKAM was held for its low Net Ops, and PEN was kept for its high Downside and very low Net Ops.
Drops
FHB was dropped for its higher Tech Flow score and KEX was dropped as it performed poorly in our screener and was filtered out.
Portfolio Summary
Long / Bull Moves – ARGX, CB adds / META, MSFT, CMPS, ASTS holds/ LLY drop
Short / Bear Moves – MGY, ADY adds / PEN, AKAM, ROST, INFY holds / KEX, FHB drops
6 Longs: ARGX, CB, META, MSFT, CMPS, ASTS
6 Shorts: MGY, ADY, PEN, AKAM, ROST, INFY

 | A guest post by
|