

REAL OPPORTUNITY
12/28/25 Prospero.ai Investing - 280th Edition (Weekend)
First off, as we reach the end of 2025, as is tradition, we are doing our largest discount of the year: 50% off.
One thing we are more focused on for 2026 is thematic in our portfolio. And as we will continue to pursue a Tech / Growth portfolio we like the idea of balancing that with Real Estate. In simple terms rate troubles will hit housing stocks perhaps as hard as Tech and we think that Real Estate is the weakest Sector heading into 2026 for a variety of reasons. Here is the setup:
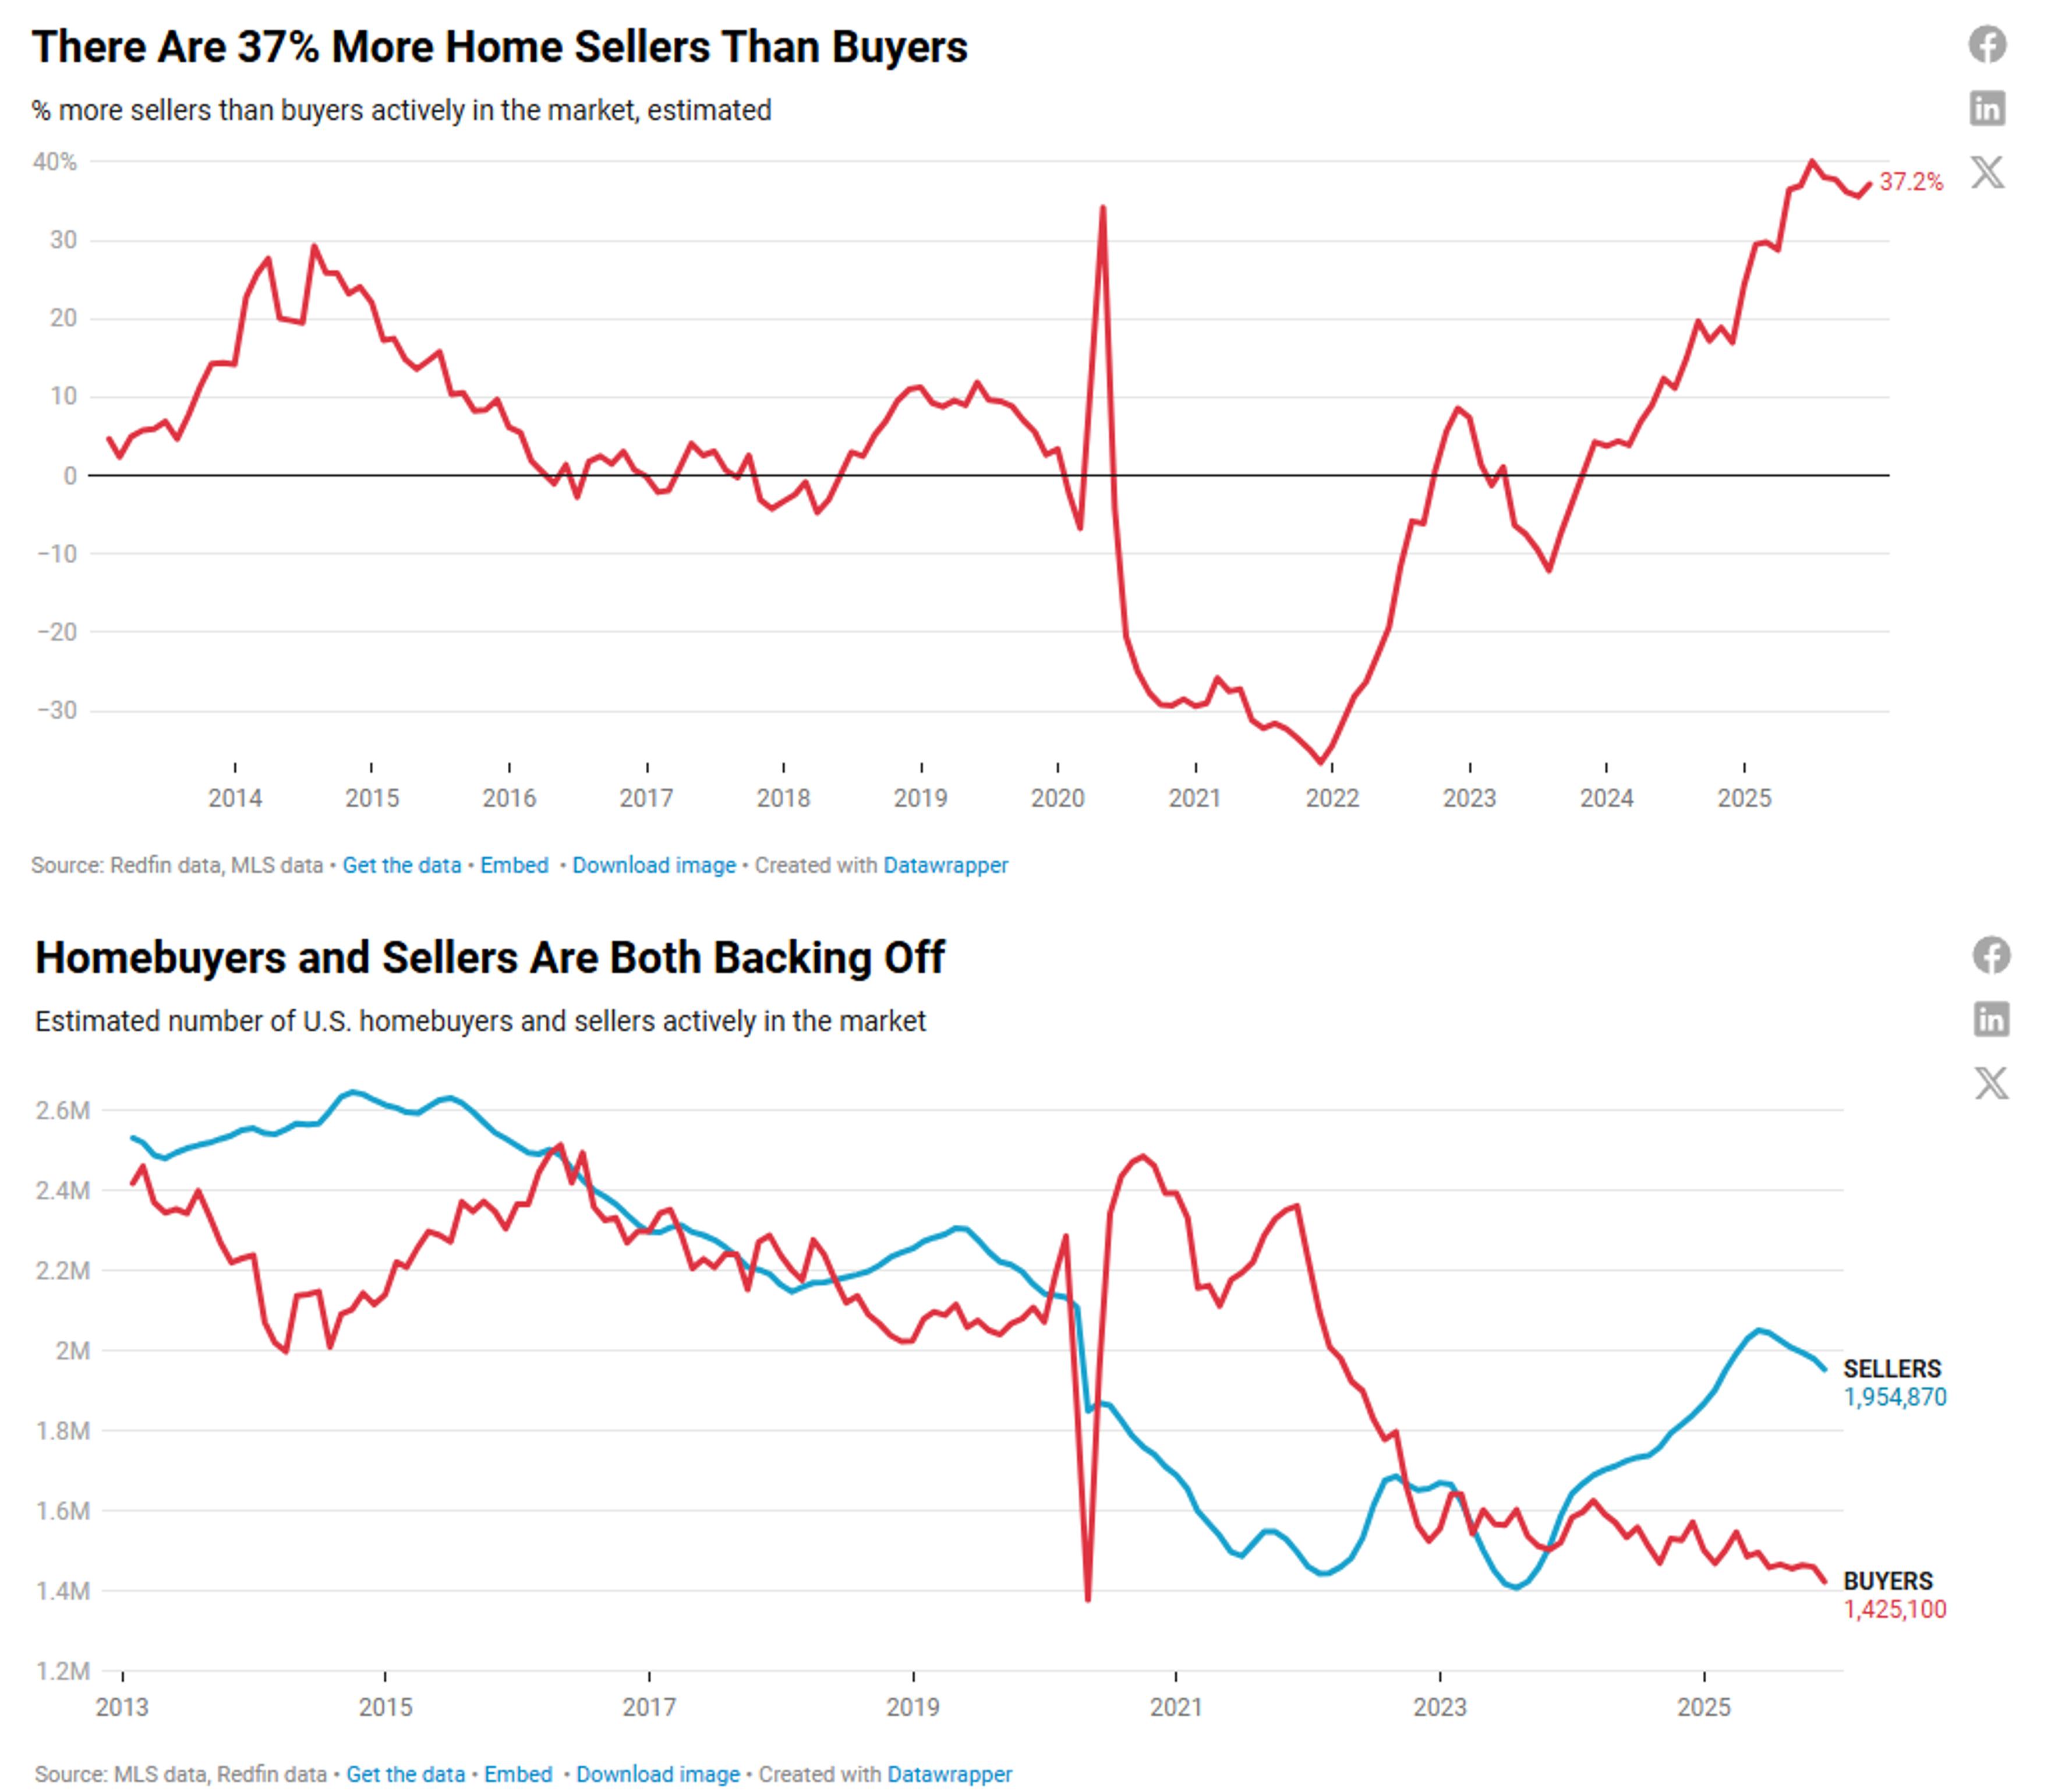
Article for the images: The U.S. Housing Market Has 37% More Sellers Than Buyers—More Than Double Last Year’s Gap
I want to walk you through something we’re seeing in the housing data that has material implications for how you should position your portfolio in 2026.
Look at the chart. Both homebuyers and sellers have essentially vanished from the market. This isn’t a normal pullback. This is a stalemate—and stalemates in housing tend to ripple through earnings in ways that matter.
The Mechanics of a Frozen Market
Start with the buyers. A typical home at current U.S. median prices paired with a 6.6% mortgage rate translates to roughly $2,200+ in monthly principal and interest. That’s up 34% from the 3% rates of the pandemic era. Most households can’t justify the payment, no matter how much they want the square footage. Affordability has collapsed to levels we haven’t seen in generations. Compound that with economic uncertainty, layoffs, soft wage growth, rising rents eating into savings—and the rational buyer stops looking. They wait. They apply for that promotion. They hope for a rate cut that may never come.
Now look at the sellers. Here’s where the stalemate gets interesting. More than 80% of U.S. homeowners are sitting on mortgages that are at least 100 basis points cheaper than current rates. Most of them have sub-4% financing. If they sell and buy again, they’re locking in a 6%+ rate on their next property. The math is brutal. Sell a $700K home and purchase something similar? Your monthly payment just jumped $500 to $800.
So sellers don’t budge either. They delist. They hold. They anchor to old value expectations because they have the equity cushion to wait. The result: fewer homes for sale where it matters, and fewer buyers competing for them. Demand collapses faster than supply can adjust.
The chart captures this perfectly. Both lines are heading downward, in lockstep. It’s not a market correction. It’s a market freeze.
What This Costs the Real Economy
Here’s what keeps me focused on this data: housing isn’t just a capital asset. It’s the transmission fluid for consumer spending and confidence.
When housing markets function, people relocate for jobs. New households form. Retirees downsize. Each transaction cascades into demand for renovations, furniture, appliances, landscaping. Regional banks make loans. Construction workers get called back. The multiplier effects are real and measurable.
When housing freezes, all of that stops. Mobility deteriorates. A talent manager who should relocate for a $200K raise decides the housing math doesn’t work—she stays put. A young couple delays starting a family because the down payment math is intolerable. A 68-year-old who should be downsizing stays in a 4-bedroom because the 3% mortgage is too precious to leave.
The aggregate effect: negative. Economic friction increases. Growth slows. Cyclical demand softens.
We’re already seeing the fingerprints. Home price depreciation hit 53% of all U.S. homes year-over-year—the highest percentage since 2012. Existing home sales fell to their lowest level since 1995. The number of active buyers just hit the second-lowest level on record, aside from April 2020.
The Stock Market Puzzle
Here’s where this gets interesting for portfolio construction.
The usual playbook would be: housing weakness signals recession; sell equities. But the 2026 frame is more nuanced. We’re likely to see a bifurcated market, and positioning accordingly matters.
Cyclical Risks: Homebuilders, building-products companies, regional bank mortgage portfolios, and consumer discretionary names tied to housing turnover face a grinding pressure. When both sides of the market are pulling back, volume-dependent businesses don’t grow—they shrink margins and fight for share. Valuations that worked in 2020-21 don’t hold in a frozen-market environment.
The Offset: Mega-cap technology and secular growth names have largely decoupled from housing-dependent demand. Their revenue streams are global, their cash flows are defensible, and their pricing power is independent of whether someone buys a house in suburbia. The S&P 500 can grind higher even as homebuilders lag—and historically, that’s exactly what’s happened in late-cycle slowdowns. This is why we will continue to focus on these businesses to pair with the short Real Estate trade.
The Rate Path Wildcard: If weakness in housing convinces the Federal Reserve to cut more aggressively than current market expectations in 2026, long-duration assets and quality growth could rerate significantly higher. That’s the bull case for duration. But if inflation stickiness forces the Fed to keep policy “higher for longer” despite soft housing data, then credit-sensitive and small-cap equities face real headwinds. The housing freeze doesn’t resolve that tension; it amplifies it. But if this happens, it is likely to benefit our Growth names even more than the Real Estate stocks.
What to Do With This
I see three levers:
1. Rotate Away from Volume Dependence. If you own homebuilders, mortgage servicers, or furniture retailers because you expect a housing boom, that thesis is broken for 2026. Consolidate into names with stronger unit economics and pricing power, or redeploy entirely.
2. Favor Secular Compounders with Balance-Sheet Strength. In a low-breadth tape where both buyers and sellers are retreating, ownership should concentrate in franchises that don’t depend on a housing recovery to justify valuations. Think strong balance sheets, pricing power, and revenue diversification. These tend to outperform in periods of elevated uncertainty and policy confusion.
3. Position for the Rate Path. The housing freeze makes a Fed rate-cut case more credible, but it’s not deterministic. You need conviction about whether inflation forces the Fed to hold or ease. If you believe rates decline, quality growth is the lever. If you believe they stay elevated, defensives and high-quality cash generators are the moat. But don’t sit in the middle—the tape will likely be too disperse to reward ambiguity.
The Broader Point
The housing market isn’t crashing in the dramatic sense. But it’s broken in a fundamental way: buyers and sellers have both stepped back, and no single policy move unlocks them simultaneously. Rates would need to drop substantially (below 6% for a meaningful period) to shift buyer calculus. But that same drop would unlock sellers, flooding supply and potentially triggering prices lower anyway.
We’re caught in a mid-cycle squeeze where the usual demand drivers are dormant, but recession pressures haven’t yet forced capitulation. That’s the environment where stock-picking and sector discipline matter most. It’s not a bull or bear market—it’s a narrow market, and differentiation is earned through conviction in which businesses can thrive without housing tailwinds.
Watch that chart. When both lines move in tandem, the economy is telling you something important. Listen carefully before you build your 2026 positioning.
We wanted to cover this idea in full but as a bonus we have what in are view are the 3 weakest sectors for 2026.
Real Estate is the standout as the worst Sector. As the average for a stock in this Sector in our bell curve is 30/100 for our most important signal Upside. (Combines information for long term call demand, analyst reports and price momentum factors. Some structural reasons our AI also highlights:
Massive refinancing wall: Over $1.5–2.0 trillion in commercial mortgages mature through 2026–27, forcing refinancing at much higher rates and crushing free cash flow.
Balance sheets under stress: Short‑term, low‑rate, interest‑only structures from the 2010s now reset higher, raising default risk, dividend cuts, and dilutive equity issuance, which drives poor equity performance.
Weak asset fundamentals: Office and some lodging segments still face elevated vacancies and tepid demand, so even if refinancing is available, net operating income often does not justify current equity valuations.
Energy has an average of 46 in the same signal Upside as well the worst score of 45 for any Sector in our Profitability forecast. Some structural AI highlights.
Structural oversupply: Forecasts show global oil markets moving into multi‑million bpd surplus by 2026 as OPEC+ cuts roll off and non‑OPEC supply (shale, Brazil, Guyana) ramps, capping prices.
Price ceiling pressure: Several outlooks see Brent drifting toward the mid‑50s by late 2026, limiting cash flow growth and leaving less room for buybacks and dividends to support share prices.
High macro and policy sensitivity: Demand is pressured by efficiency gains, EV adoption, and decarbonization policy, making earnings and multiples vulnerable to any downside macro surprise.
Consumer Cyclical has an Upside average of 48, Profitability average of 48 and the lowest Growth forecast average of 45. Some AI highlights:
Slowing consumer momentum: Surveys and spending data point to pullbacks in discretionary and semi‑discretionary categories as wage growth slows and consumers feel “silent pain.”
Balance sheet fatigue: Many households are drawing down savings and leaning more on credit cards, which constrains future big‑ticket and experiential spending that drives sector earnings.
High operating leverage and valuation risk: Discretionary names often run high fixed costs and premium multiples, so even small revenue disappointments can sharply hit margins and trigger outsized price declines.
A WORD FROM OUR CEO
With the crazy volatility in the market we have been playing more defense than offense. Sometimes that is the best thing to do at the end of the year, protect your gains. But we will get more aggressive in 2026. Our paper trading portfolio is 17% above the market on an annualized basis, with a 58% win rate against SPY benchmarks.
Our short intro + learning videos get you up to speed on how best use our letters and app to increase your wins.
Regular streams this week. 12/29 at 11 AM ET and 12/31 at 3 PM ET.
Track all of your investments in real time with our app. Prospero’s proprietary AI tech updates key options signals like Net Options Sentiment, Upside and Downside every 3 minutes.

REAL OPPORTUNITY
Market/Macro Update w/ Cap/ Value Analysis
QQQ and SPY Net Options Sentiment
Sector Analysis
How we view the Sector performance and momentum
Portfolio Strategy
Putting it all together to make a portfolio that first controls for risks but also has upside
Longs
Adds —> Keeps —> Drops
Shorts
Adds —> Keeps —> Drops
Portfolio Summary
CAP / VALUE ANALYSIS
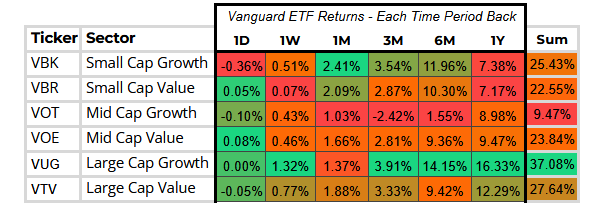
Large‑cap Growth led all style categories this week, with Large‑cap Value posting respectable gains as well. The market tone suggests investors are rotating back into the usual secular winners as confidence in the macro backdrop improves. In contrast, Value stocks broadly lagged after a strong multi‑month stretch. I’ll be watching closely to see whether this week marks the start of a meaningful reversal or just a temporary pause in the Value trend.
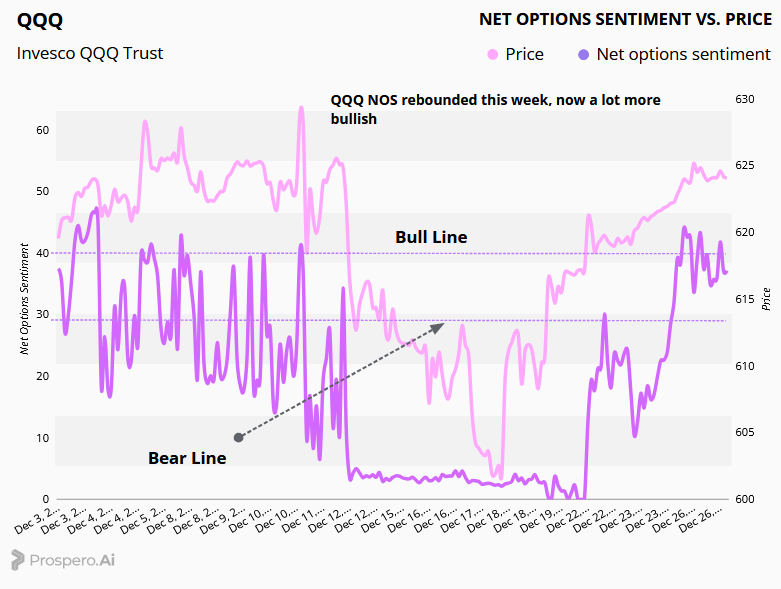
QQQ NOS flipped decisively bullish this week and looks poised to stay that way barring a major earnings miss from the mega‑cap cohort. With momentum re‑accelerating across the category, this may be an opportune moment to reassess and potentially lean more heavily into tech exposure.
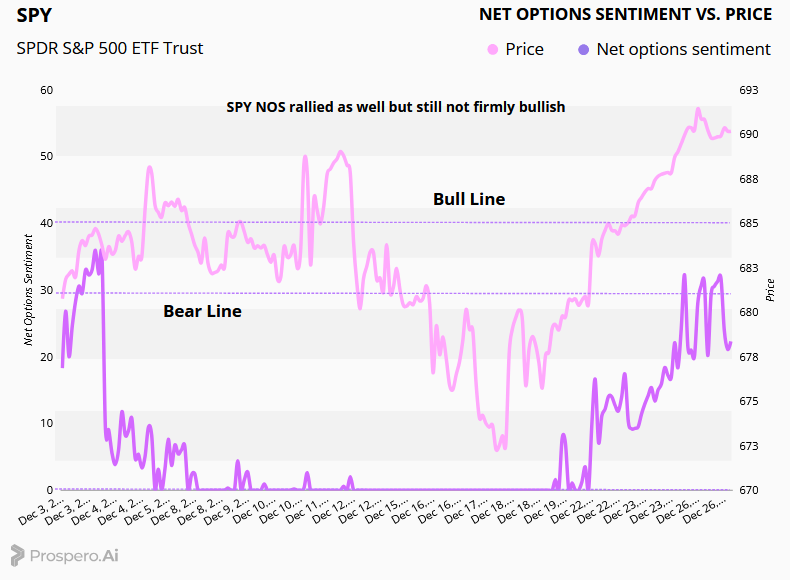
SPY NOS rebounded as well as is no longer firmly bearish, but still no signal of some sort of broad based rally, most of the gains still driven by a few key sectors.
SECTOR ANALYSIS (Link to live, it will be different since this letter was sent)
Materials extended their winning streak as commodity prices surged, supported by strong Asian retail demand and continued central‑bank buying. Tech and Communication Services also rebounded meaningfully, making it reasonable to shift some allocation back toward growth rather than staying overly hedged. Consumer Defensive, meanwhile, continues to screen as one of the weaker sectors and remains a compelling short candidate.
PORTFOLIO STRATEGY
With SPY and QQQ NOS turning more bullish versus last week, we’re adjusting our positioning accordingly while maintaining our core longs, which continue to perform well, and staying selective with any new short ideas. 4 longs, 3 shorts.
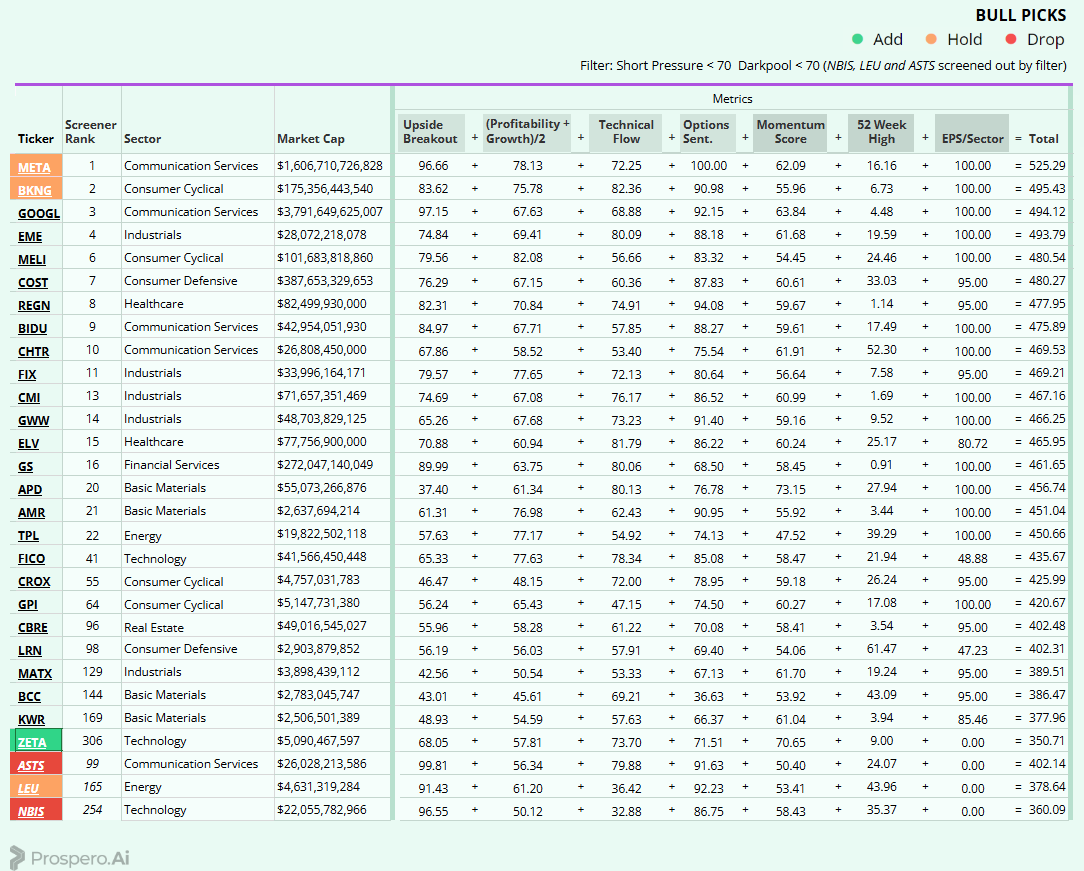
Long / Bull Moves – ZETA add / META, BKNG and LEU holds / ASTS and NBIS drops
Adds
ZETA was added for small cap Tech exposure with great Momentum. This has been a hot retail name for a bit and we have had our eye on it we could not ignore the 70+ momentum score to end the week.
Holds
META and BKNG were held as they came in at the top of our screener with great Upside and Net Options. LEU was held for similar reasons and for small cap exposure.
Drops
ASTS was dropped as it had no standout metrics and a declining momentum score just north of 50. NBIS was dropped as Net Options was not high enough.
Short / Bear Moves – ZS and MNRO adds / ATEN hold / ARM, DELL and LEN drops
Adds
ZS was added for large cap Tech exposure. MNRO was added for its poor earnings power and Net Options.
Holds
ATEN was held as a Tech short with poor earnings power.
Drops
ARM was dropped as we liked ZS more. DELL and LEN were dropped as they were screened out.
Portfolio Summary
Long / Bull Moves – ZETA add / META, BKNG and LEU holds / ASTS and NBIS drops
Short / Bear Moves – ZS and MNRO adds / ATEN hold / ARM, DELL and LEN drops
4 Longs: ZETA, META, BKNG and LEU
3 Shorts: ZS, MNRO and ATEN
Paid Investing Letter Bonus with Momentum Score
