


PROSPERO SOARS, NET OPTIONS PLUMMETS
06/01/25 Prospero.ai Investing - 225th Edition (Weekend)

It's official. We're entering this week pretty bearish. But before we jump into why we're concerned, we have some really exciting news! First, we're honored to announce that Prospero.ai was just named "Best AI Fintech Start-Up in the U.S." by Global Financial Market Review! We're blown away by this award and want to thank each of you in the Prospero Family that helped make this possible. Second, we launched today on Product Hunt. We know our products have helped a lot of you so please help more people find us by upvoting and reviewing at this link!
Now let's jump into why we're concerned heading into this week. Over the last few days, we've noticed some eerie similarities between last week, and the week prior to the S&P having its major market correction in February. As we've shared at length, our SPY and Net Options Scores have been a market cheat code, and a primary example was in February we were alerted about a the market’s impending drop before it happened. How? Because we saw a sudden, bearish decline in both QQQ and SPY net options.
Let's walk through the timeline and I’ll show you the similarities with last week. As a reminder, the market began its historic correction on the week beginning Monday February 24th. But it's important to remember, that in the days before the drop, there had been a weird divergence in the Net Options Scores of QQQ and SPY. QQQ had been bullish (over 40), while SPY Net Options were bearish and had dropped to low single digits. The market chopped around a bit; and around 9:30 AM on Friday Feb 21st, 3 days before the correction began in earnest, that divergence suddenly changed. We sent this alert on X…
That post on Friday morning was 100% a sign of something more ominous. Because on the following Monday, the the market would begin a historic correction in the S&P 500. Here's our point. What first alerted us to possible correction, was when our SPY Net Options dropped to single digits (ultimately 0), and the previously bullish QQQ (40's) suddenly turned downward to a very bearish 18. That move warned us that Institutions and Hedge Funds had suddenly turned extremely bearish on both SPY and QQQ!
How is that similar to this last week? An almost identical set of events just happened. Just last Thursday at market close, we had a similar divergence in our SPY and QQQ Net Options. QQQ NOS was a firmly bullish 46. SPY NOS was in the single digits. But by the next day (last friday), SPY Net Options dropped to 0, and QQQ suddenly dropped from 46 to 17! Sound familiar? It should. That's almost identical to what happened right before the big drop on the week of February 24th.
Now, it's important to note, there's one major difference between that week in February and what happened last Friday. Primarily, as the market closed last week, QQQ Net Options was actually creeping upward and ended the day at 23. But on the Friday before the big drop in February, QQQ Net Options kept creeping downward and ended the day at 3! Big difference. So it's entirely possible that in light of all the political uncertainty, that all this is just some serious hedging by institutions, and not some precursor for a serious drop. But again, the similarities in the two events are certainly worth noting.
There are two more really interesting data points that informs our bearishness. On Feb 9th, the week before the S&P would hit an all time high, Prospero released an article titled Did We Discover That Institutional Risk Appetite is Falling Off A Cliff?. This is one of the earlier warning signs of the large market drop to come we saw anywhere. It all began when on the previous week, our CEO George Kailas noticed that a number of Large Cap stocks dropped an unprecedented 40+ "Upside" points in a single day. When George and I spoke about it, he stated: "In our metrics, for a single company to move 10 points downward in a week is uncommon. For a large number of Large Cap stocks to drop 40 points in a day, simply doesn't happen". When he investigated, he discovered something that stopped him in his tracks. He found that 55 Large Cap Companies that had long term options contracts >320 days to expiration in 2024 had zero long term options contracts of the same kind anymore. He couldn't remember a time in his entire career when he'd seen anything resembling that behavior. The reason for this anomaly is still a bit unclear, but it seemed incredibly strange to George, that almost 11% of Large Cap Companies no longer had options coverage greater than 320 days out. In our article, George hypothesized that the reason for the non-existence of the contracts was that the future of the American economy was so uncertain, that Wall Street's risk metrics couldn't accurately portray an options bet they felt confident in.
According to this post on LEAPs from FirstTrade his hypothesis looks accurate. “The exchanges ensure that sufficient interest is present in the market, and that market-makers or specialists are prepared to price and trade longer-dated options once they are listed.” In hindsight, all of that institutional uncertainty makes complete sense. As we shared earlier, by the end of February, the S&P 500 fell off a cliff, and has since climbed back to almost all time highs. Pretty unpredictable.
But here's where it gets even more intriguing. As we've done more research George discovered 32 new ones have been added to the list. (3 stocks did have long term options coverage re-initiated) That's now a total of 84 Large Cap stocks with zero options coverage for 2026. That brings the population of uncovered stocks from 10.86% (in February) to up to 16.06% today. While the market has been rallying, it's important to remember that institutions are always willing to pile on and make some money with that momentum. But despite the rally, institutions are leaving a lot of signs that they are still highly concerned about the medium to long term economic picture in our country. George describes it like this: "Selling options contracts is a huge profit center for institutions. So choosing this path of non-renewal seems to reflect a complete lack of confidence in their own ability to model what is to come."
So when you combine the drop in Net Options Sentiment with the weird, "fear of new long term options" anomaly, it's hard to be even cautiously bullish. I guess in this market, anything is possible, but then there's one more data point that points to bearishness. We just saw a post by @Barchart that revealed Japan sold off 12 Billion worth of stock last week. Why does that matter? Because it's Japan's largest stock sell-off in history. Like in their entire history. Ever. And the next closest week, was a sell off of about only 8 billion. That's not good folks. Something is brewing. Let's be careful out there. Now a word from our CEO…
A WORD FROM OUR CEO
We had a stellar end to the week hitting on 8/8 of our last bull picks and 6/6 of our last bears. Hitting on long/short at the same time is a big reason this is our best year. Our paper trading portfolio is 118% above the market annualized with a win rate of 61% against SPY benchmarks.
Check out our new app tour video if you’ve ever ever been confused on how to use our app. Our short intro + learning videos get you up to speed on how best use our letters and app to increase your wins.
Slightly Different Stream Times This Week. Monday 6/2at 10:00 AM ET and Wednesday 6/4 at 3 PM ET.
Track all of your investments in real time with our app. Prospero’s proprietary AI tech updates key options signals like Net Options Sentiment, Upside and Downside every 3 minutes.

PROSPERO SOARS, NET OPTIONS PLUMMETS
Market/Macro Update w/ Cap/ Value Analysis
QQQ and SPY Net Options Sentiment
Sector Analysis
How we view the Sector performance and momentum
Portfolio Strategy
Putting it all together to make a portfolio that first controls for risks but also has upside
Longs
Adds —> Keeps —> Drops
Shorts
Adds —> Keeps —> Drops
Portfolio Summary
CAP/VALUE ANALYSIS

Growth stocks have extended their edge over the past week, led by Large- and Mid- cap growth, up 2.16% and 1.46% respectively. Large-cap growth in particular has been boosted by some strong tech earnings, notably from NVDA, and continued momentum in the current AI investment cycle. Value has been flatter overall: while Small-cap Value gained just over 1% on the week, it remains up 5% for the month. Large-cap value remains relatively muted at +1.39% on the week and +2.95% for the month. Monthly returns across caps have broadly cooled, reflecting growing concerns over weak manufacturing data and renewed talk of tariffs coming from Washington. For now, investors appear to be rewarding scalability and margin resilience.
SECTOR ANALYSIS

Real Estate was the standout this week, seeing a climb of 2.68% surrounding declining bond yields, interest rate expectations, and strong performance from REITs. Communications also held up, buoyed by strength in streaming and ad platforms. Consumer Discretionary was also strong, adding 1.50% on the week and being up 8.38% for the month, supported by resilient consumer spending despite broader economic concerns. Healthcare extended its monthly decline, down over 5% over the past 30 days, while Energy continues to reel from a week Q1 earnings season . Materials and Utilities posted modest gains, up 0.75% and 1.06% on the week, and 2.92% and 3.83% for the month, respectively— benefiting from a shift toward more defensive and rate-sensitive sectors.
SPY/QQQ NET OPTIONS SENTIMENT

SPY NOS has flatlined this past week amid ongoing concerns following Moody’s credit downgrade and persistent trade policy uncertainties. Sector performance has been mixed, with weakness persisting in energy , modest gains in materials, and strong rebounds in consumer discretionary. Meanwhile, real estate has stabilized, while healthcare continues to face pressure, extending its monthly decline.

QQQ NOS dropped earlier in the week due to the same factors weighing on SPY NOS. While strong tech earnings, tariff delays, and QQQ reaching key support levels fuelled a short-term rally, market concerns brought it back down to end off the week.
PORTFOLIO STRATEGY
Given the flatline in SPY NOS and that QQQ NOS keeps giving mixed signals, we’ll be maintaining a net short positioning. We’re keeping our options open going into the week with focus on diversification both in sector and market cap space. 5 longs, 8 shorts.
Long / Bull Moves
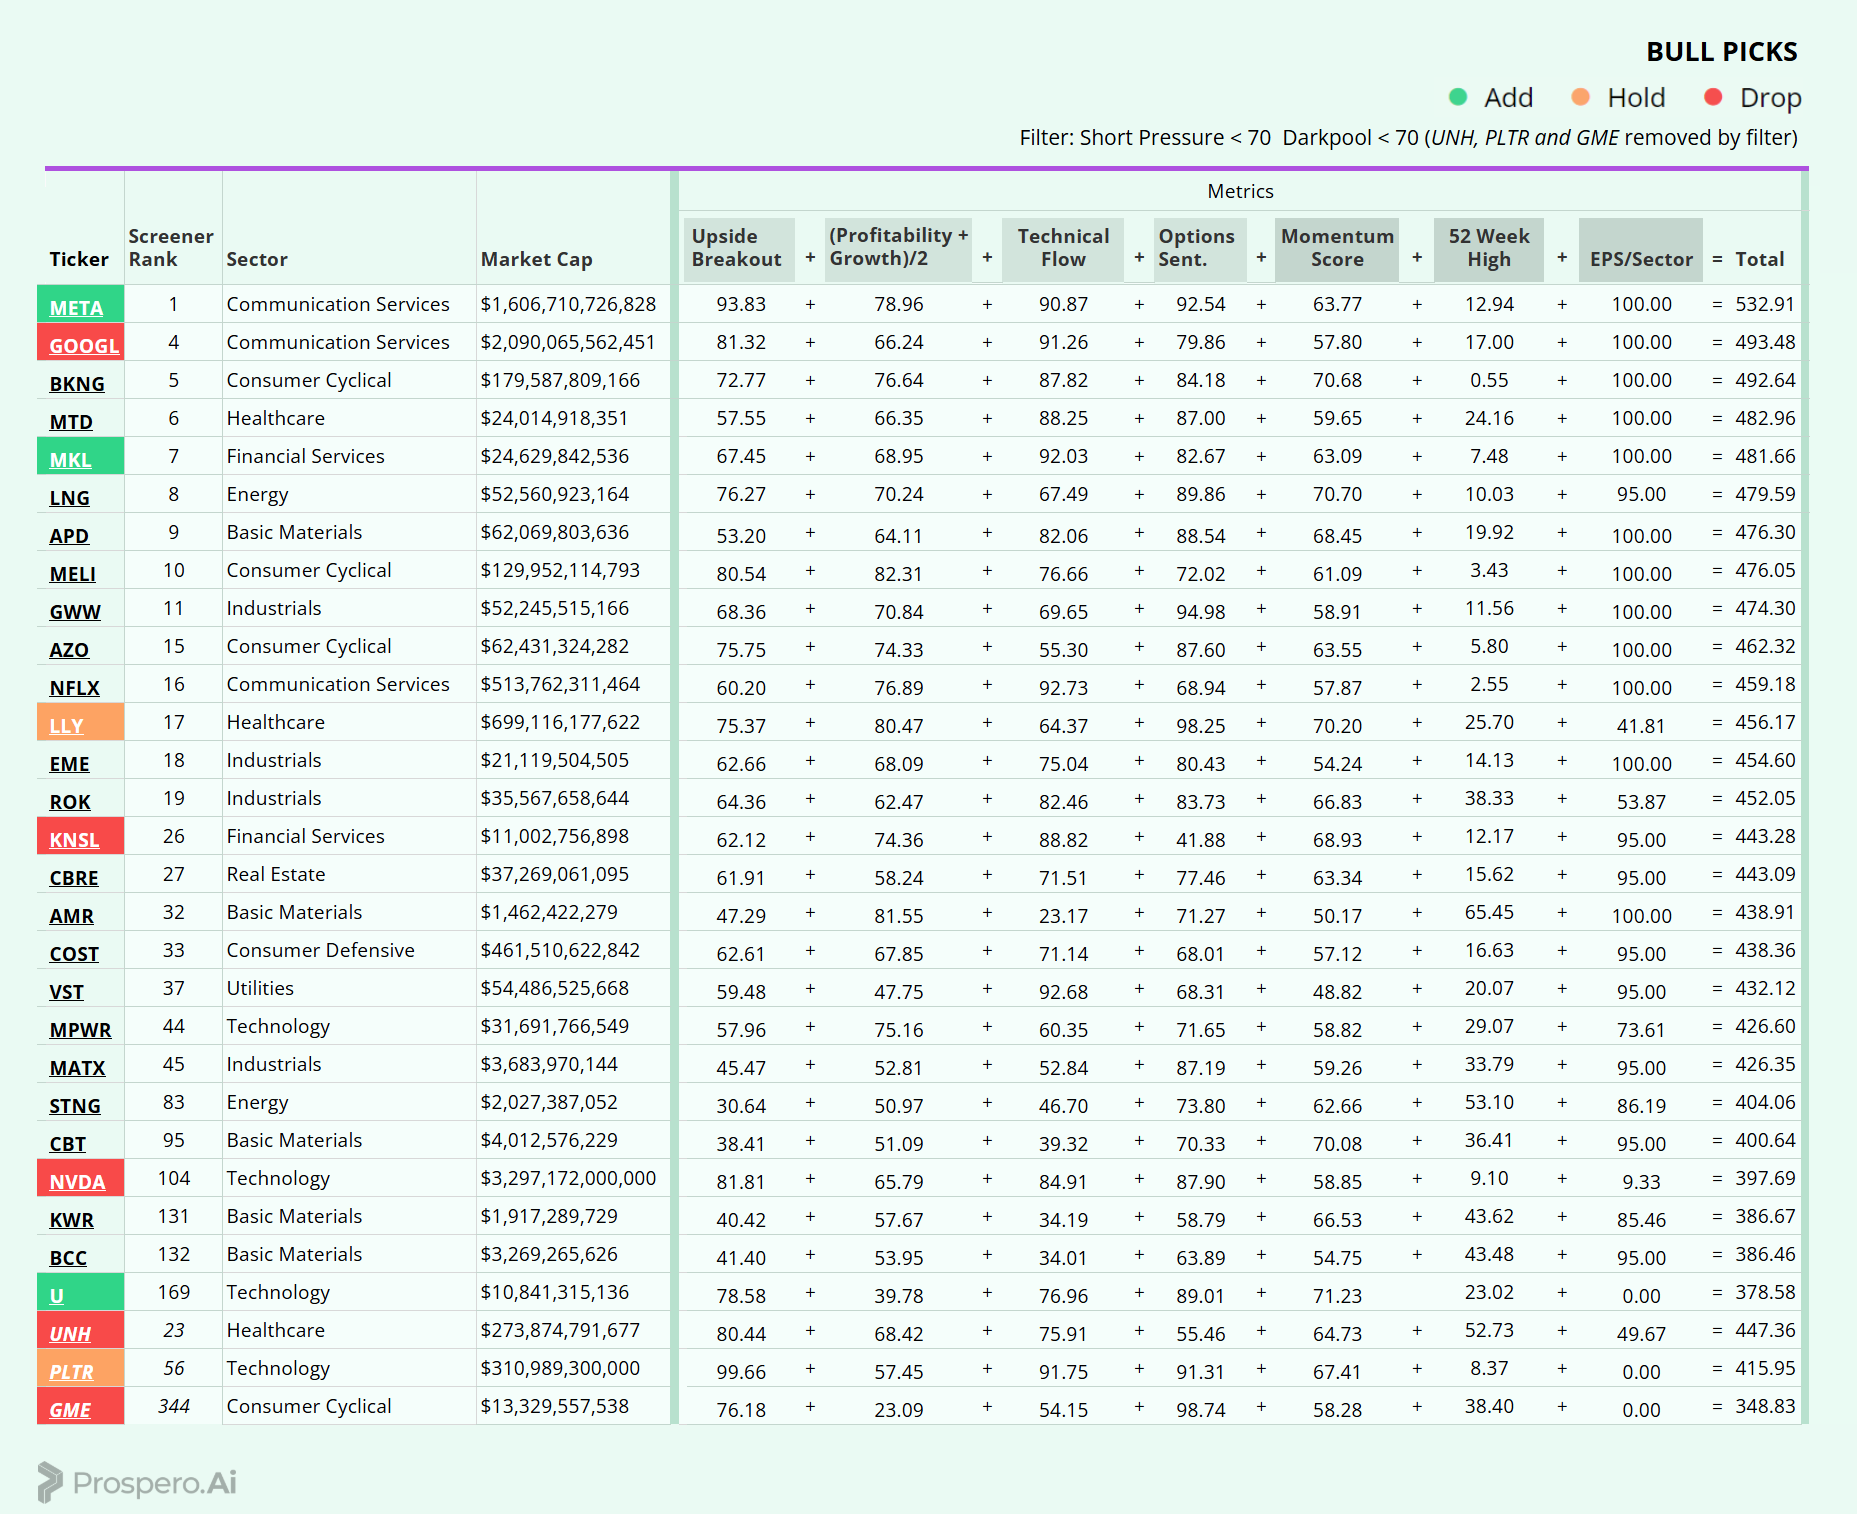
Long / Bull Moves - META, MKL and U adds / LLY and PLTR holds / GOOGL, KNSL, NVDA, UNH and GME drops
Adds
META was an easy choice at it placed at the top of our screener. MKL looked good with 90+ Tech Flow. U seemed like a good smaller cap tech pick with great Net Options Sentiment.
Holds
LLY was a no brainer with almost perfect Net Options. PLTR was also an easy choice with almost perfect Upside Breakout and great Tech Flow and Net Options.
Drops
GOOGL, KNSL and UNH were dropped due to subpar Net Options. NVDA and GME were let go due to poor performance.
Short / Bear Moves

Short / Bear Moves - NAVI, LEVI, JNPR, FYBR and LOGI adds / SABR, NCNO and NXPI holds / J, ST, CGNX, CRUS, DLB, MTH and TSM drops
Adds
NAVI was added as it placed at the top of our screener with great Downside Breakout. LEVI was needed for Consumer Cyclical exposure with poor earnings power. JNPR and LOGI were added for larger cap Tech exposure. FYBR was added for low Net Options and larger cap exposure.
Holds
SABR was kept for solid overall metrics, NCNO was held for low Net Options and poor earnings power. NXPI was held for favorable Net Options and large cap Tech exposure.
Drops
J, ST, CGNX, CRUS, DLB, MTH and TSM were all dropped due to poor performance.
Portfolio Summary
Long / Bull Moves - META, MKL and U adds / LLY and PLTR holds / GOOGL, KNSL, NVDA, UNH and GME drops
Short / Bear Moves - NAVI, LEVI, JNPR, FYBR and LOGI adds / SABR, NCNO and NXPI holds / J, ST, CGNX, CRUS, DLB, MTH and TSM drops
5 Longs: META, MKL, Y, LLY and PLTR
8 Shorts: NAVI, LEVI, JNPR, FYBR, LOGU, SABR, NCNO and NXPI
Paid Investing Letter Bonus with Momentum Score
Keep reading with a 7-day free trial
Subscribe to Prospero.Ai Investing Newsletter to keep reading this post and get 7 days of free access to the full post archives.